Product Prioritization: Models, Trade-offs, and Decisions
Prioritization is the product manager's main practical tool. Its purpose is to help the manager point the team's resources at developing the product and reaching the main goals while avoiding local optimization. Prioritization is often just called "focus".
Prioritization is the product manager’s main tool
Prioritization is the product manager’s main practical tool. Its purpose is to help the manager point the team’s resources at developing the product and reach the main goals while avoiding local optimization. The prioritization process is often just called “focusing.”
To work out which activity has the most positive effect on reaching the goal, and to put those tasks at the top of the priority list, you need a model of reality. A simplified representation of what you’re doing, one that has predictive power. Frameworks are a way to get there.
What is a framework?
A framework is a blank for a model. A template for a schematic representation of reality. Product managers use it to make concrete decisions:
- what to focus the team’s attention on,
- where to spend more effort and where to spend less,
- in what order to act.
There’s a widespread belief that there are “correct,” “canonical” ways to use frameworks. I don’t share it. I think every chief product officer should have a model that fits their particular product. And to get there, they have to be able to pick one, tune it, or change it wholesale to fit their context.
I’m convinced that the only criterion for choosing a model is its effect on the quality of the decisions you actually make. In practice that means putting certain properties of the system into your field of attention, plus the model’s predictive power. That is, the match between the states the model predicted and the events that actually happened.
A development team can and should adapt any tool to its own specific tasks and activity. Your prioritization system will work better if it’s tailored to you.
Most prioritization frameworks are somewhat rigid and often lean on numerical data. At the same time, the frameworks themselves take no responsibility whatsoever for how complete and reliable the data you feed them is. They serve as a visualization tool, giving you a picture of the current state of affairs. Don’t assume the numbers the model shows you will make decisions for you. It’s an approximate representation that shows the picture at some level of coarseness. People make the decisions. Rely on rational thinking, combine the numbers with your own expert knowledge, and make considered decisions. A table full of numbers is only the basis for your choice.
I picked up this principle from Kahneman, in “Thinking, Fast and Slow.” In 1955, as a lieutenant in the Israeli army, he ran into the problem of building an effective system for selecting soldiers for combat units, inspired by Paul Meehl’s book “Clinical versus Statistical Prediction.” The existing unstructured interviews were completely useless for predicting a candidate’s success, so Kahneman developed a hybrid approach: first the interviewers rated candidates on six concrete traits (responsibility, sociability, “masculine pride,” and others), and then, once the structured part was over, they closed their eyes and gave an overall intuitive rating. The results beat expectations: “The big surprise was that the intuitive judgment at the end was just as accurate as the average of the six ratings, and it added new content,” Kahneman recounted decades later. That experiment became the basis of his main principle of prioritization: “Break the problem into parts, evaluate the aspects independently, and only then use intuition” — an approach that proved the combination of structured analysis with expert intuition works better than either method alone, provided you apply them in the right order (Episode 022: Deciding, Fast and Slow with Dr. Daniel Kahneman, Alliance for Decision Education, 2024).
If you need to prioritize a list of any kind of candidates, good practice is to first understand what makes the participants in this competition more or less valuable to you — that is, to develop your own system of metrics. To weigh those candidates within that system of metrics. And then, having gathered the facts, to make a decision from an expert position while looking at the numbers. Frameworks simply help you select those criteria and organize them into a visible form.
Before you start prioritizing
1. Check that you can actually carry out some kind of strategy for your product.
There’s a strategic triad: the subject, the object, and the subject’s intent toward the object.
- The subject is the product manager. They have to hold the authority to make changes in the system they oversee.
- The object of the strategy is the product itself, which is a continuous process of delivering value to users. The product manager’s task is to bring the product to the goals that have been set.
- The intent is the subject’s desire and readiness to apply effort to the object. That is, the product manager has to not only be able to bring changes into the product, but also want to.
It may look like Captain Obvious talking, but I’d still recommend running a simple self-check before you get into prioritization. If any of the strategic elements of the triad is missing, we have practically no chance that the prioritization effort leads to anything other than a loss of time and effort.
2. Define your product’s goal.
Priorities are determined by the goal. Without a goal, any comparisons and qualitative adjectives like “better,” “more effective,” “faster” have no practical meaning. And the effort to define priorities will be useless. So before working with this chapter, make sure you understand your goal. In plain words — that you really understand what you want to achieve. If there’s no goal yet, it’s too early for prioritization.
There are other approaches for defining a goal, and they need to be considered separately from this chapter. Prioritization helps you operate on tasks inside goals.
3. Sharpen the goal in terms of changing people’s behavior.
In the end, any product is effective only insofar as it promises improvements in people’s behavior. If your actions don’t lead to noticeable changes in the behavior of some group of people, then ultimately they’re meaningless, because they don’t change the product’s economics or its effect on the world.
So: you need a manager who understands and shares their goal, can describe it in terms of changing people’s behavior, and has the authority to apply it to the product. If all that is in order, let’s move on.
In the next part I’ll go through the popular frameworks. What they output is all the same thing — an answer to the question of which things to do in which order. But I want to say it once more: don’t treat these approaches as canonical — they’re a place to start from, so that later you can develop your own approach.
Framework 1. The Eisenhower Matrix as an introduction to the problem with all frameworks
A backlog is a linear list of assignments the product team carries out over some period. Linear, because the more important tasks — the ones you need to do sooner — sit at the top of the list.
You can determine the order of actions with the Eisenhower Matrix. It has four cells:
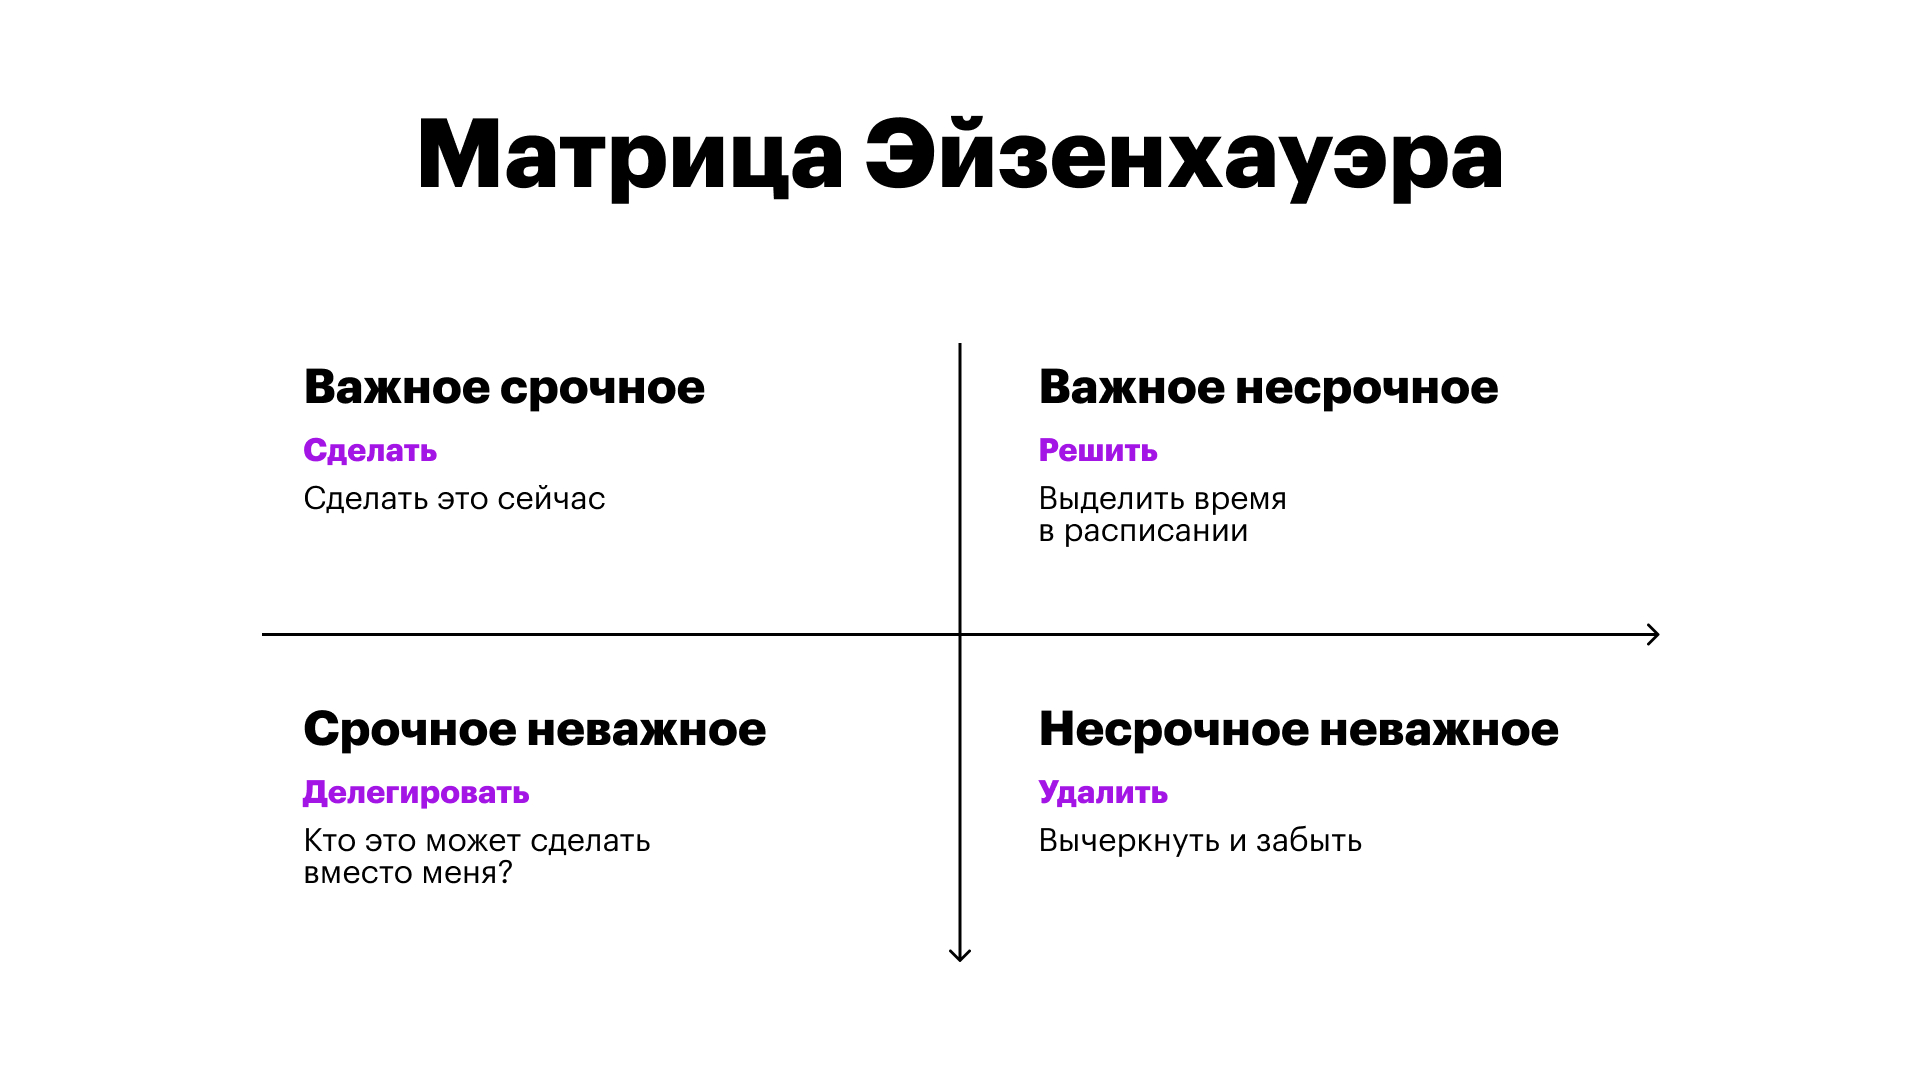
This square has a fairly simple problem: the urgent-but-unimportant kills the important-but-not-urgent. Important things only get done once they’ve become urgent.
What to do with the other two quadrants is obvious enough:
- tasks that are urgent and important will have to be done urgently;
- tasks that are urgent and unimportant should be thrown out.
But how to balance the urgent (with deadlines and advocates demanding urgency) against the important (with the greatest effect on getting closer to the goal, but not yet on fire) — that’s 80% of the hassle in any prioritization. If you do nothing about it on purpose, you’ll naturally focus on “Urgent/Important.” And that leads to systematic underinvestment in the “Important/Not urgent” quadrant.
Lean startup philosophy offers a simple approach: while the system is still small, while you have no processes and you’re risking nothing except the future of your own startup and the seed investment, you can afford not to do a great many things. In other words — do more of the important, stop doing the urgent. Accept the losses and focus on growth.
The choice comes down to distributing priority among the important things.
But the more grown-up the company gets — the more has been built, found, and put into operation, the more people you have leading separate fragments of the process, the more clients and partners — the more risks, obligations, and problems will appear, competing for resource with the important problems.
The more you’re risking, the harder it is to choose.
Question: how do you get to the important tasks on time? Delegate the unimportant urgent stuff to others. A product team’s throughput is always limited by the attention of its leaders. So try to arrange things so that the people capable of speeding up the work with their actions and thinking don’t spend their thinking on something that won’t bring you quickly closer to the big goal. In other words — everything except what has the greatest effect on product growth has to be outsourced one way or another: to support functions (if you’re a corporation), to outside companies, to individual people hired to unload the leaders. The method doesn’t matter, the effect does: leaders stop dealing with urgent unimportant tasks.
I understand this is easy to say and hard to do. So the whole rest of the chapter is about how to work out what’s most important, and how to manage focus of attention so that important candidate-tasks have a better shot at the team’s attention.
By and large, all the other frameworks I’m going to talk about are ways of balancing out this skew.
Framework 2. TOC, or prioritizing from the bottleneck
The term “bottleneck” is part of the TOC methodology (theory of constraints) by Eliyahu Goldratt. He’s the author of “The Goal” — one of the most valuable business books there is, in my view. There’s also “Goldratt’s Theory of Constraints” by William Dettmer on the same subject — a collection of all of Goldratt’s models in the form of diagrams and manuals.
First, TOC is a system for optimizing flow. The approach applies if we can picture the business as a pipe with a flow of value running through it. Goldratt calls this “throughput.” It can be a flow of money, or goods, or clients — anything. What matters is that it’s a characteristic unit that’s convenient for describing the state of the business.
The most common universal unit for measuring flow is money — you can measure absolutely everything in it. So it’s worth being able to express the flow in money, or more precisely, in the throughput of money through the system: how much money the system is able to pass through itself per unit of time. That is, money not in statics but in dynamics.
Second, the flow always has a section that limits its throughput — that is, it determines how much “water” passes through the narrowest part of the pipe and, consequently, through the whole system. Goldratt calls this the bottleneck. Because whatever the diameter of the pipe in its various parts, only as much water will pass through the system as seeps through the narrowest pipe.
TOC does a good job of showing what’s worth focusing on right now to maximize growth. If we apply effort to widen the bottleneck, the whole system feels the effect.
And if we apply effort anywhere else, we divert resources away from the most important thing. And if that place is upstream of the bottleneck, we also increase the load on it and make the problem worse. This is called doing local optimization — trying to improve a part of the system that isn’t the one currently limiting its throughput. And it does real damage.
From Goldratt’s point of view, doing prioritization means:
- Find where in the system there’s a jam — which place is the bottleneck.
- Come up with an intervention that will widen that bottleneck.
- Carry out the intervention.
- Make sure the bottleneck has been widened.
After that, some other pipe becomes the narrowest one, and you’ll have to move your effort to a different part of the system.
Good practice, in my view, is a rolling schedule for two parts of the team:
- one does business development — prepares tasks for the development team, works on diagnosing where the bottleneck will move once we widen this one;
- the second works directly on widening the bottleneck.
That way everyone always knows what to do next.
But the attention of every team member at any given moment still has to be aimed at the current bottleneck, because hypotheses about how to widen it don’t always work on the first try.
The more effect an initiative has on the bottleneck, the higher priority that task gets.
How it goes in practice
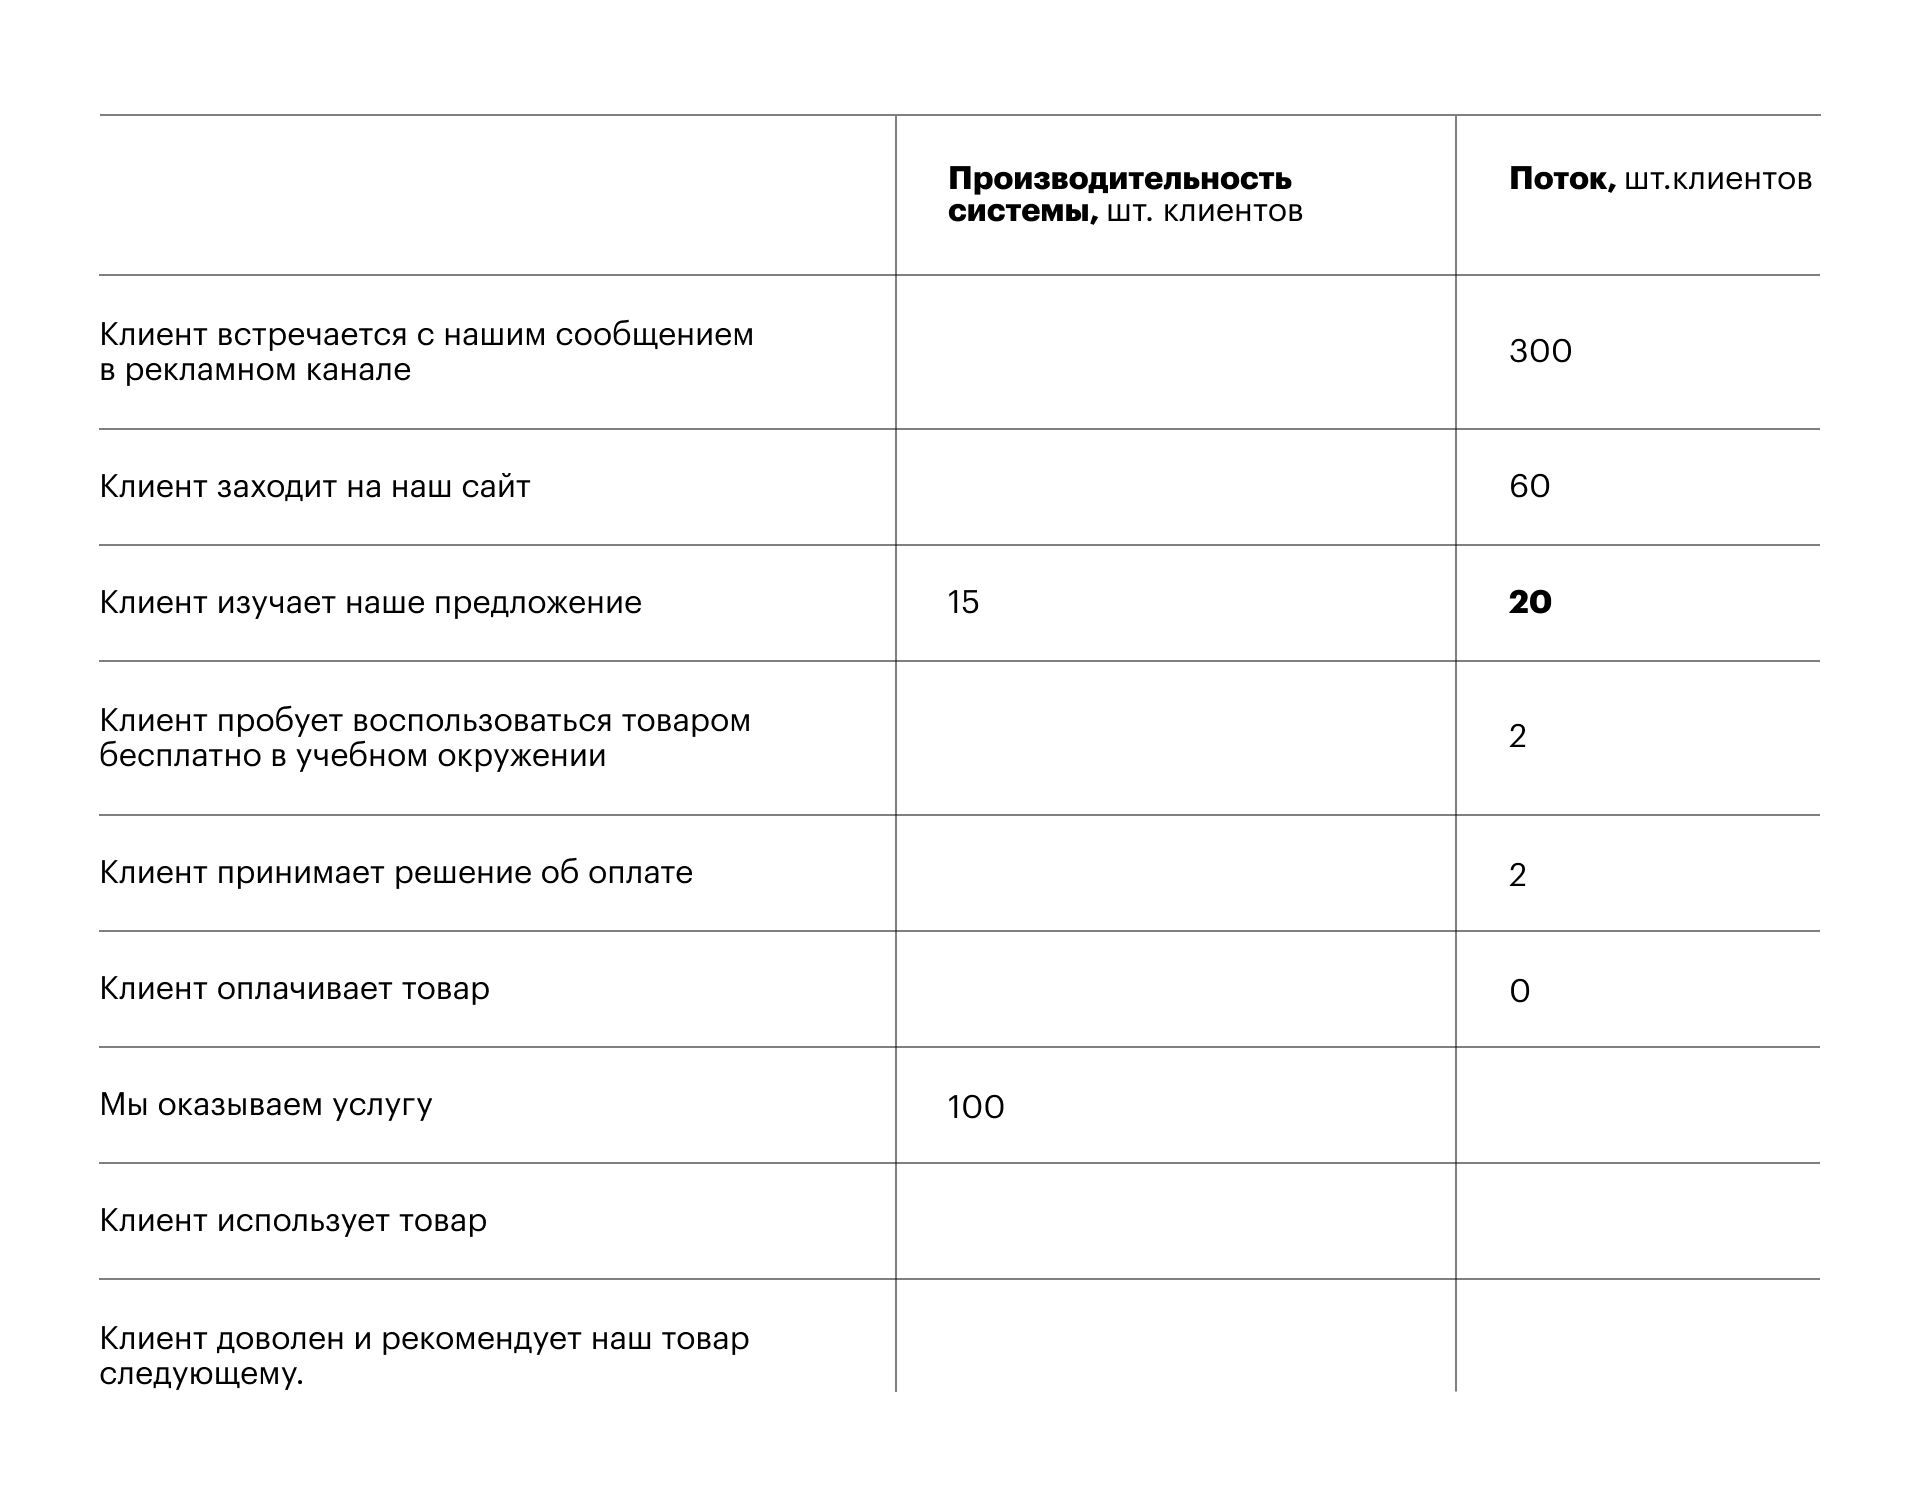
My table has two columns. The first is the system’s throughput. Here we list the places with limited capacity. The second is the flow going through the system. That’s how many clients we actually have here right now.
The rows are the steps of value delivery. It’s convenient to list them from the end — from the point where value has been delivered. For example: the client is happy and recommends our product to the next person. Before that, obviously, they use our product or service. Before that they pay for the product. And earlier still they make the decision to pay. And so on, back to the moment of first contact with our offer. That’s the sequence generalized across most cases.
The table can be filled in from any point — from whichever one we know something about.
The current state of the system raises a question: how many of the notional parrots flowing through the system are we able to serve?
If we’re moving a client through the system, our question is: at what number of clients trying to use our product do we stop coping?
If we’re talking about a physical product like vacuum cleaners, we don’t count how many clients use or don’t use the vacuum cleaners — that doesn’t strain our system’s resources — but how many vacuum cleaners we can produce per unit of time. Because our system is limited at that place.
Sometimes the constraint can be how many payments we can accept per unit of time. For example, our sales manager is capable of selling to two clients a day, which is 40 clients a month. As long as we have one manager, we physically can’t sell to more than 40 clients. This problem isn’t relevant for a website — there we can sell to any number of clients.
At the beginning I said that the whole prioritization system goes down the drain if we’ve lost the connection to the goal. And TOC effectively says the same thing, just in a stricter formulation.
When we have some KPI and we’ve been told our task is to optimize a metric, then whatever metric we pick, the attempt to optimize it will inevitably lead us into local optimization. Which is why, by the way, it’s harmful to pay bonuses for metrics.
You have to optimize the bottleneck and look at the metric that at that moment shows we’re applying effort in the right place.
How not to slide into local optimization
If you work as a product manager on a mature product, and you’re not the CPO but someone more junior, then most likely you’re not handling the whole product but some fragment of it. Loosely speaking, you’re the product manager of a feature or a metric. How do you avoid sliding into local optimization in that setup?
Say you work at an education startup and your task is to increase the second conversion — that is, to make the client who paid for the first period of courses pay for the second.
To start with, you need to restore the connection to the goal:
- understand where your subsystem sits within the overall system of goals,
- where the bottleneck is right now,
- and whether you can do your activity in a way that affects the bottleneck. If you can’t, you have problems.
One of Goldratt’s most sobering and important thoughts is this: when you aim your effort at something other than the bottleneck, you’re not merely failing to help. You’re doing damage. And it’s not only that you’re diverting the attention resource of the team’s leaders. Remember the Eisenhower square? Local optimization is a source of urgent but unimportant tasks. That leads to the bottleneck’s throughput going down. For the details, read “The Goal.”
In my view, this is a problem of large systems. But ensuring the throughput of the whole system isn’t the job of an individual product manager. It’s the CPO’s main job to make sure that at every moment all team members are focused on maximizing the flow.
Business architecture in the tree metaphor
As I said, TOC applies if you can look at the system as a chain of value delivery. I think if you can’t express your system as a flow of value, its organizational architecture is probably bad. So next I’ll make a lyrical digression and talk about what I consider good architecture — with the help of a tree metaphor.
Imagine your product is a tree. Users see what’s above ground: interfaces, client-facing processes, the product, the advertising. That’s the trunk and the branches. And that’s the main value the product creates.
Below ground is your back office: employees’ internal processes — production, legal, financial. Every business has its own, and it’s enormous. Those are the roots — clients don’t see them.
Now let’s look at what kinds of trees there are.
The pine
A pine has a pronounced trunk — you can see it has a central axis around which everything is built. That’s an example of good architecture.
A funny moment. Imagine the tree is the time axis. Then it grows up and down at the same time, as roots and crown, and the point where it touches the ground is the start of the product’s development, the zero point. That’s the time of interaction with the market: the more grown-up the product, the higher it grows and the deeper it digs.
While a pine is growing, it’s very slender, it always has a clear striving in one direction, upward, where its crown is. The pine says: “I know which market I’m present in, I have a foundation, it’s clear what I grew around, and now I can throw out a dense crown.”
The pine gives everything most important to its clients. It has a slender concept and, in fact, a not very deep root system. Which is why pines are easy to uproot and grow quickly.
An example of this architecture is a search engine. It answers visitors’ questions. It has a pronounced main screen on which the user gets their main value — an annotated list of links to sites. The more relevant that output is to the query, the better the search engine, and everything else like Yandex Market, Google Photos, Maps is already additional branches that grow later and lean on the trunk.
Another example of a clear trunk is a taxi-hailing app. It moves a passenger from one point to another, sending a car quickly and predictably. For passengers it’s the fastest way to get a private car at a fair, predictable price, and for drivers it’s a way to get a flow of clients.
Obviously, when a taxi app gets big, like Uber and Yandex Taxi, it can say: “Now I’m a superapp, I’ve got delivery, premium cars, cars with child seats, and mini-games in stories.” But those are branches. It’s still clear which case is the main one and which process the main value flows through.
All in all, the pine is a good one — be like the pine.
The spruce
A spruce also has a single trunk, but it has a lot of side branches growing right from the bottom. Looking at a spruce, we don’t see the trunk, but we can tell exactly where it is.
There’s an assumption in my metaphor here: in real life a pine doesn’t turn into a spruce over time. But in a product, if you had a pronounced axis you were growing along, then later branches appear all along the trunk — because wherever the flow of value is, you want to widen it.
For instance, the iPod was once the first streaming service in physical form. It was a device for listening to music with access to a store. So the iPod is a pine. The iPhone, on the other hand, was built around the store from the start, and the store had a multitude of programs from the start. It even had a slogan: “There’s an app for that.” So the iPhone is a spruce.
The oak
With an oak everything is complicated: the road was laid wherever the cow happened to walk. It’s not very clear what the original design was, which direction the oak wanted to grow. Sometimes its branches are so enormous they look like separate trees.
An example of an oak is the business of a big holding company. It has various huge processes, they all have their own automation, in some places they’re very tightly coupled, and in others completely separate.
And that’s even harder than the pine, because it’s not very clear whether a new offshoot fits into the product’s concept and whether we’ll be able to present all this as a process where on one side we load in raw material and on the other we get money, and it flows as one big river. But viable oaks do exist.
The bush
This is the most widespread architecture, because a bush doesn’t need a concept, it’s easy to design: everything grows any which way, you just need to do something. Felt like it — it grew. A branch broke — well, screw it, we’ve got plenty of those.
What’s bad about bushes? They have no focus, they never get very big, they’re hard to capture a market with, and they don’t have a very long lifespan. On the plus side, you don’t have to suffer over the concept.
The mushrooms
Mushrooms are worse than bushes. This is the favorite genre for skimming a budget: clients see a little nub on top, everything else is underground and very branched out. There’s no client interaction, value doesn’t particularly flow. Mushrooms grow when either from the very start no one wanted to do anything and the goal was to take money for the size of the mycelium, or they wanted to make a pine, but the focus was underground rather than above it. Don’t be like mushrooms.
— Can you grow a pine where the mushrooms are?
Of course you can, only don’t imagine that mushroom roots are pine roots. You just have to plant a pine instead of the mushrooms. Maybe someone knows how to grow a slender concept out of processes that were built for a different task. But that’s not me. If you rework something old, at best you’ll get a bush. And more likely you won’t even make it out into the market.
— How do you recognize good architecture?
In my view, good architecture has a core process. If we can’t see it, if we can’t show the structure as a flow of value — our architecture probably isn’t the best.
A viable, durable architecture has a pronounced trunk, and the trunk in this case is the main flow of value delivery.
Conclusion: prioritizing from the bottleneck is the most effective approach, but not the simplest and not always attainable
TOC would be the best framework if we kept working with countable units of value delivery along the whole path of its creation and delivery. Unfortunately, mental work has a fundamentally different nature. As Matt Gunther says: “TOC’s focus on throughput creates playing faster moves in chess.” Unlike a production line, where the bottleneck is usually physical and stable (a specific machine, say), in digital product development the constraint is more often knowledge, communication, or uncertainty in requirements — factors that often can’t be “widened” by simply adding capacity or measured with a simple instrument. A superficial application of TOC can lead to optimizing the number of completed tasks at the expense of their quality. All in all — TOC is great, but applying it effectively is quite hard.
So let’s look at something simpler.
Framework 3. RICE as a hypothesis-weighing machine
RICE is the second most widespread framework. The acronym stands for Reach, Impact, Confidence, and Effort.
RICE is built on roughly this idea: “Let’s find the low-hanging fruit and eat the tasty, easy-to-pick stuff first, and when that runs out, we’ll get to the filling stuff that’s hard to cook or keeps running off into the woods.”
You have to look at all of this, too, as a system with a flow of some kind of parrots running through it: deals, clients, money, holdings, iPhones.
RICE says: “Let’s take on the initiatives that bring more effect per unit of resource spent.” That’s its main thought.
Effect is the value you’ve picked for yourself: money, clients, deals. And for the resource spent, I prefer to take the time of the scarcest resource. For example, if our scarcest resource is the team lead, let’s denominate everything in team lead hours. If it’s the sales department, let’s count sales department team-days. If it’s calendar time, let’s denominate everything in that. And if you’ve got almost no money left and you’re economizing on everything — in rubles.
At the beginning I talked about Kahneman and his method for selecting officers. In our case the candidates are the hypotheses or chunks of functionality we’re about to spend effort on. We need to come up with some system of parameters, weigh the candidates on those parameters, and make decisions while looking at the results. And RICE is one specific bundle of those parameters. This framework lets you prioritize hypotheses by visualizing your intuition — very quickly and very coarsely.
An example of applying RICE
Let’s take some service, a corporate website, say. We want to turn it into a flow of clients. To do that we need to create chunks of functionality that will help us. We turn to RICE.
1. We put forward hypotheses about what we could do to have more clients:
- add more case studies to the site,
- buy more traffic,
- build a referral program.
When working on a real product, there are usually dozens or hundreds of these ideas, maybe thousands. We’ll limit ourselves to three for the example.
2. We nominate the RICE parameters.
We have:
- R — reach,
- I — impact,
- C — confidence,
- E — effort.
We need to score them somehow. Collecting real-world figures is hard, because there are usually a great many initiatives. You’ll either pull numbers out of thin air or work yourself to death. So it’s worth doing two passes: first score the parameters in notional points, weed out the non-working ideas, and only then move to real-world figures for the candidate tasks that made it into the top of the list.
Let’s take a scale from 1 to 5. Five points on reach is the largest flow of whatever runs through our system. In our case let that be target clients. Five points on impact means that if we act on the flow of clients at this place, it will increase severalfold. And 1 point means there’s no impact, or it’s negative. With confidence it’s just as simple — how confident we are that this initiative will have an effect: 5 means fully confident, since we’ve already had it happen, and 1 means we haven’t tried and don’t know. Effort is different in that here less is better. Five is the largest expenditure we’re prepared to bear within this initiative. Let’s say that’s a quarter’s profit. And 1 is the minimum necessary investment, for example when the initiative can be rolled out in a day.
All the points are relative. It’s a weighing of intuition and nothing more. Just make sure that before you apply RICE, you agree on what the extreme and middle values of each scale mean — so that afterward you can correctly interpret the results of the experts’ scoring.
4. We weigh the parameters for each hypothesis.
Let’s look at reach as the example. The first hypothesis is “Let’s add more case studies to the site.” The cases will sit somewhere inside the site, which means not all the clients passing through our marketing system will see them. So it can’t be the maximum and we can’t give it a 5. But we reliably know that cases regularly bring in search traffic — there’s a flow there. So we can give it a 3.
The second hypothesis is “Let’s buy more traffic.” That way we’ll definitely interact with a larger number of clients. But how many of them will be on target? We give it a 4.
The third hypothesis is “Let’s introduce a referral program.” To give it a score, we need to understand how many clients currently flow through the referral program. If we don’t know that, we can’t give it a high score, but we’re confident that someone will definitely come. We give it a 2.
After that we score the parameters for the remaining hypotheses the same way.
That was a first pass at RICE in the style of scrum poker: we made sure we understood what we were talking about, gathered the opinions of those present — visualized our intuition. It’s easy to notice that RICE leaves a gigantic field for errors and arbitrary will. So this is simply how we agree on which of the hypotheses we’ll describe in more detail: dig into the analytics system, talk to clients, get benchmarks from the market, and pull out concrete numbers. Once we’ve calculated everything in real-world figures, we’ll see what increase in clients each hypothesis promises to deliver.
There’s also a similar idea called ICE — here the set of words is slightly different: Impact, Confidence, Ease. You can make your own mutation of the parameters. But that won’t make the approach any more accurate, it will just make it more specific to your task.
RICE, or ICE, or your own variation visualizes the lowest-hanging fruit. But the decisions should be made by you, not by a table of numbers.
The problems with RICE
It lies. If a behind-the-scenes war breaks out on the RICE stage, then it’s lights out, toss the grenade — things will get very bad. Because it’s a very coarse method. You can only use it if you’re capable of not lying to yourself. And it lies harder the more heterogeneous the initiatives you’re weighing.
It has a hard time prioritizing expensive tasks. RICE exists precisely to find low-hanging fruit, not to build a product strategy. If you use only RICE, no pine will grow — you’ll get bushes.
It provokes local optimization. Because low-hanging fruit can be in very different parts of the system.
RICE can test the earliest hypotheses, when you don’t yet have an understanding of the market segment. Then what flows through RICE is respondents or insights. And it’s a way to generate more insights, from which you can later build a trunk. But it won’t build the trunk for you.
For the trunk you need TOC — it helps you grow a pine. And RICE helps you find initiatives that will have a big impact for a small amount of effort. But it’s not an instrument of strategic planning and not an instrument for managing multiple growth.
I’d say the best use of RICE is managing the priorities of the support team. Precisely the part of the team that takes on the “keeping the lights on” effort so the growth team doesn’t get distracted. For them it’s an ideal instrument that tells you which part of the estate needs cleaning today.
Framework 4. RAT, or the riskiest hypothesis
There’s a certain hassle in testing hypotheses. Some think you first have to find the market and make sure you’re operating in a growing niche, and only then work out what to make money on here. Others say you first have to make sure you’re capable of delivering value at all, and only then work out who to sell it to. The riskiest hypothesis is one way to choose a path.
Usually we think of risks as bad events. But in general, and especially within the riskiest hypothesis, these are any probable events. Not only bad ones, but good ones too.
There’s a hypothesis that may come true with some probability, and this will affect the goal somehow — not necessarily negatively. You should work through the backlog starting from the most influential hypothesis.
In risk management, the cost of a risk is the risk’s probability multiplied by the risk’s effect on reaching the goal. And the riskiest hypothesis helps you find the most valuable hypotheses out of that product and prioritize the backlog by effect on the goal.
Risks are denominated in the goals of whatever we’re occupied with — the system we’re setting strategy for. In our case, in the product’s goals. The units in which we measure a risk’s effect are “one goal.” So there’s some risk. If it fires, we lose some percentage of the goal: the target market gets smaller, or income shrinks, or something else.
This method can work as a numerical one only in cases where there’s a flow of events rather than a single risk. For example, you can’t put numbers on whether a competitor currently operating in a different market might diversify in our direction. We have no base to extrapolate from. But if we’re doing scoring for insurance cases, then we can calculate the occurrence of an insured event and its cost.
How to work with the riskiest hypothesis
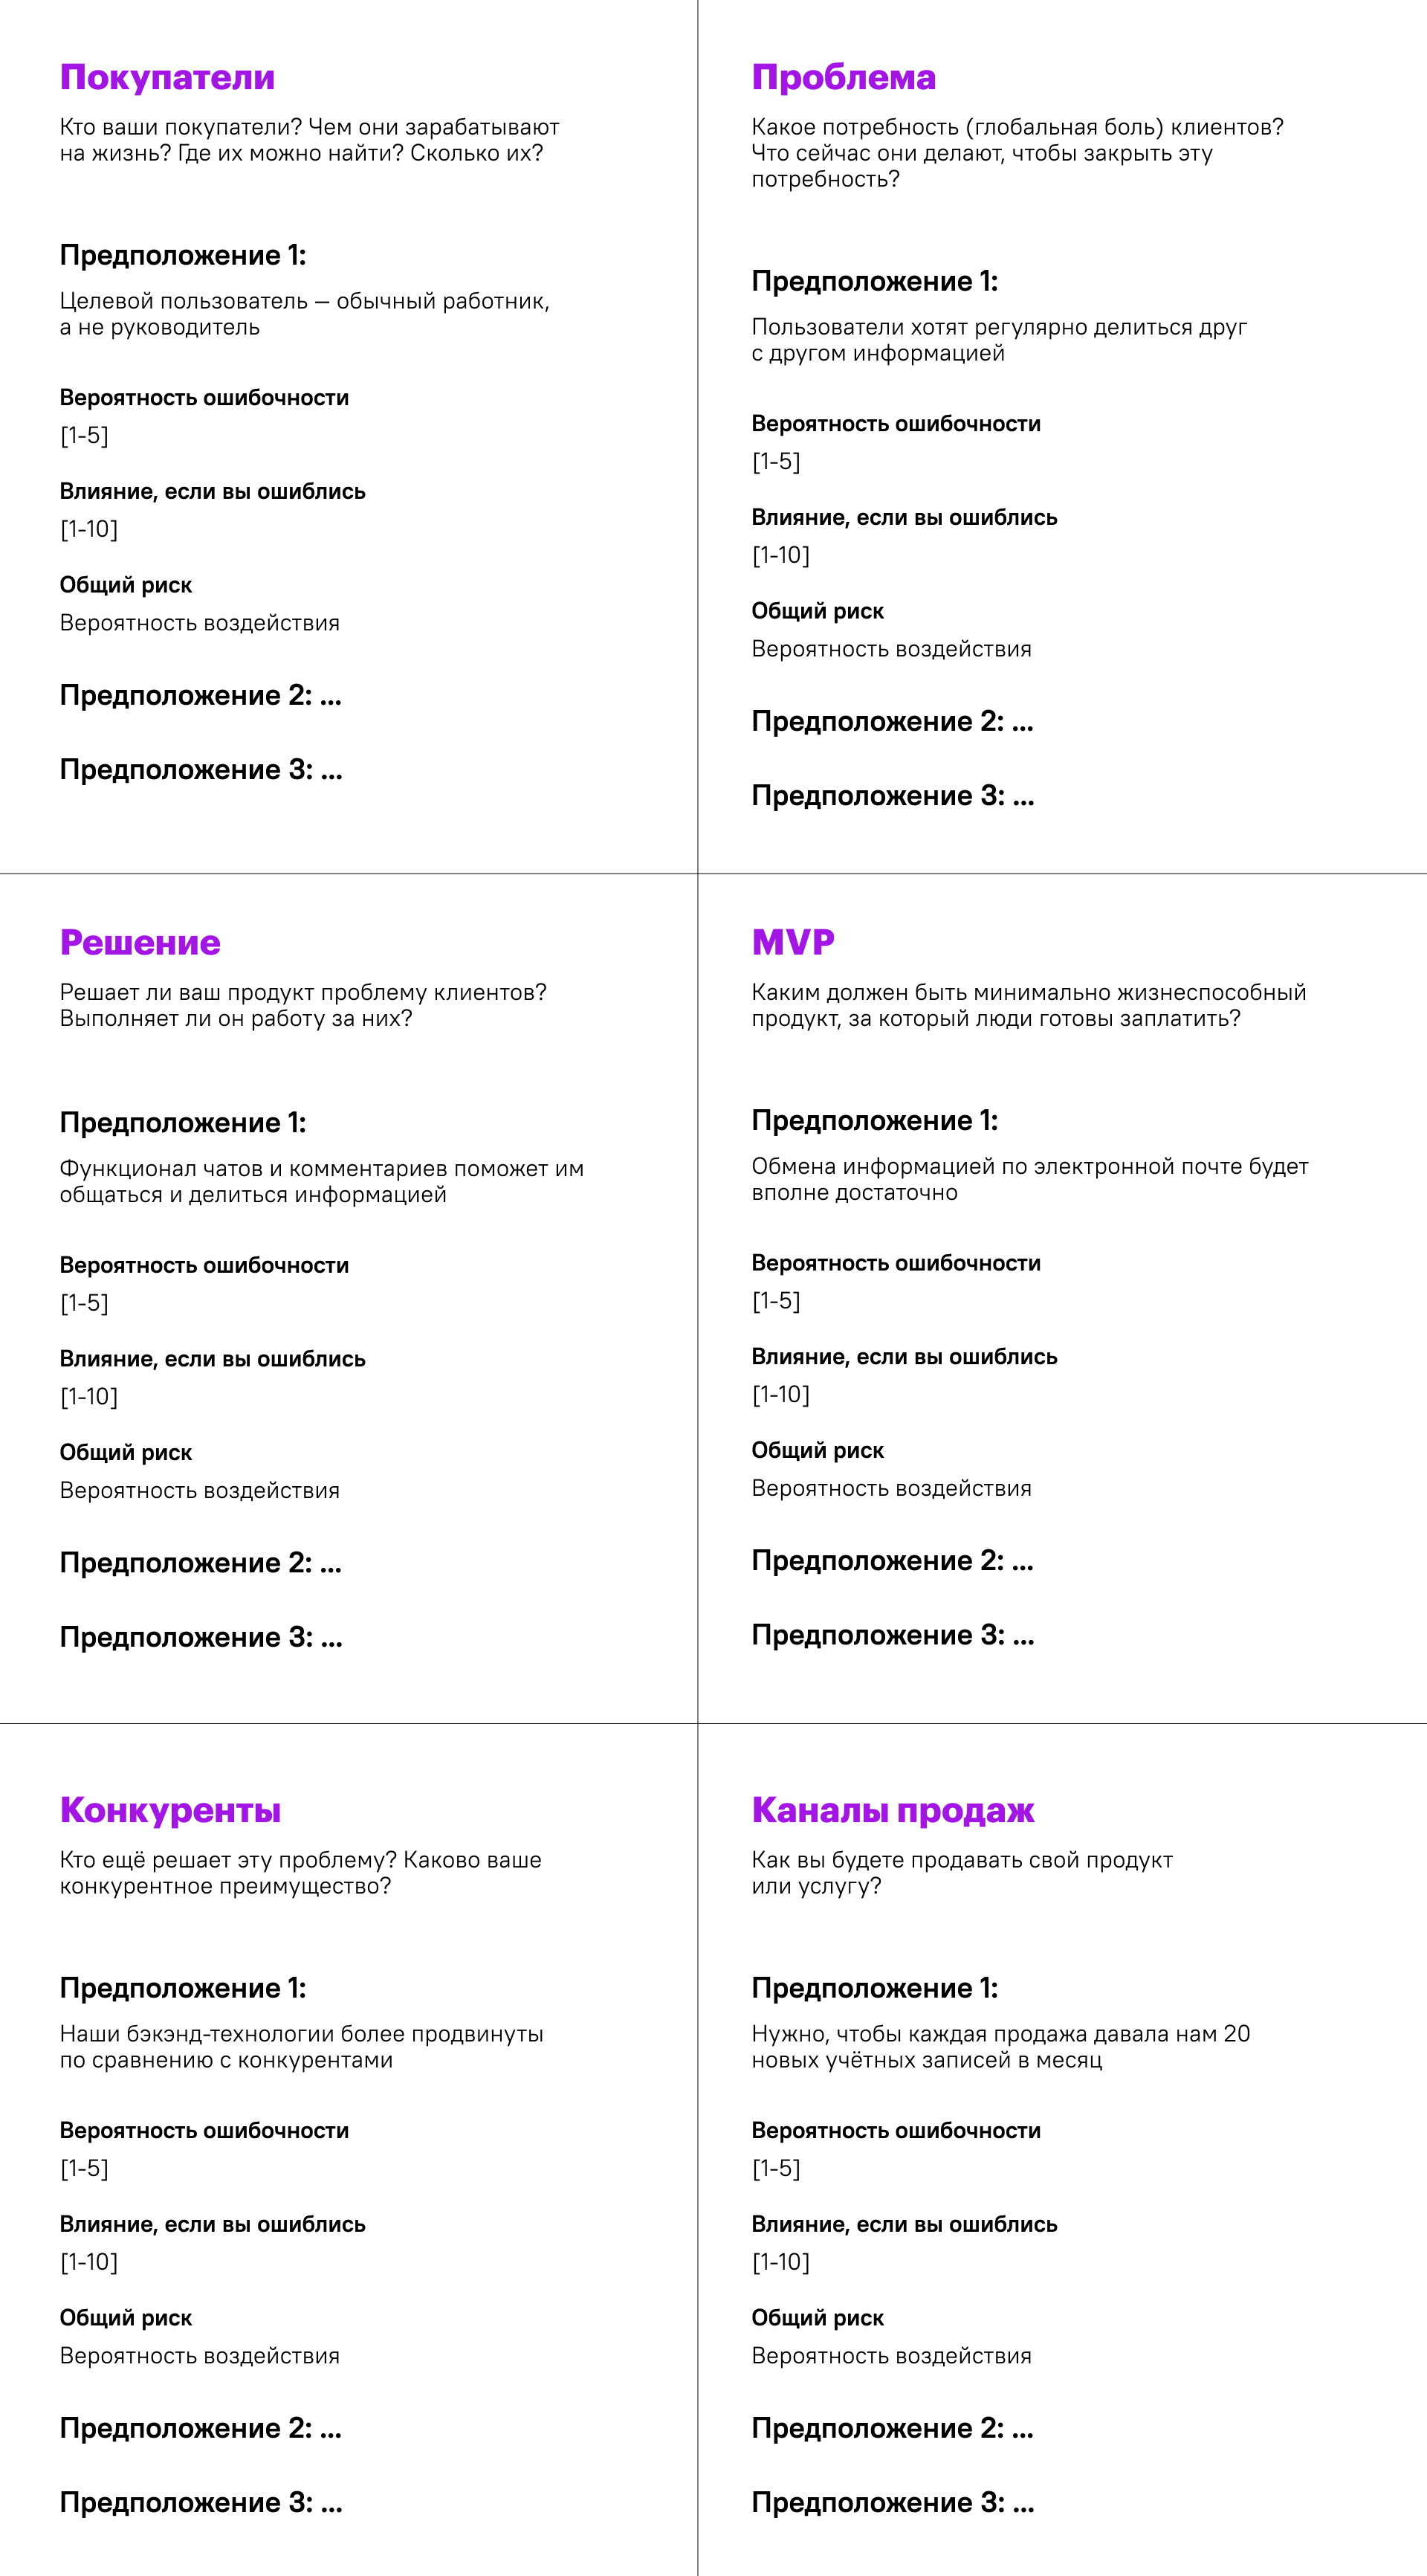
- We build a table listing the main aspects of the business, for example:
- buyers — the target group,
- their problem,
- our solution,
- its early implementation — the MVP,
- sales channels,
- and what competitors are doing to solve this problem.
The set of categories can vary — depending on your business.
- For each box we find a list of the factors that have the greatest effect on the business. As an example, let’s take the VR rides we make at JetStyle.
We start building assumptions:
- let’s say our buyers are representatives of points of interest like Disneyland or VDNKh,
- they’re interested in monetizing their location,
- they’re commercial directors,
- their problem can be solved with a ride, because it creates more of an impression of the place for end clients,
- as the MVP there should be a ride with a good VR experience and recreated locations,
- and so on.
- We ask ourselves about every assumption: what if it isn’t true, how strongly will that affect our goal.
If it’s not a commercial director but someone else, we’ll simply find that person and change the target. But if they aren’t interested in monetizing the flow at all, that has a very strong effect, because then they won’t buy the value we’re offering. In the first case it’s a part of the goal, in the second it’s our entire goal. That is, one whole point of risk.
-
Once we’ve identified a factor with a big effect, we need to work out its probability. For that you have to do research.
-
So in each of the six categories a winner will emerge — the most influential hypothesis. And now we need to identify the absolute champions among them. We find the hypothesis whose confirmation will have the strongest effect on the business and put it first in the backlog.
And this, again, is not canon
The riskiest hypothesis lets you recall the main aspects of the business. The table is an example; you should make your own after looking at what the main processes and stages in your business are.
Framework 5. Quality Function Deployment
Quality Function Deployment means structuring (deploying) the function of quality. QFD was developed in the late 1960s at the Mitsubishi shipyards in Kobe by professors Akao and Mizuno. BuzzClanITU Online Toyota popularized the method after implementing it successfully. The method helps answer the question of which technical characteristics a product should have so that it’s exactly what the client needs.
In the classical approach there’s a list of client wishes and a list of features that could be implemented — and with the help of special notation we assess how much each feature affects the fulfillment of a specific wish.
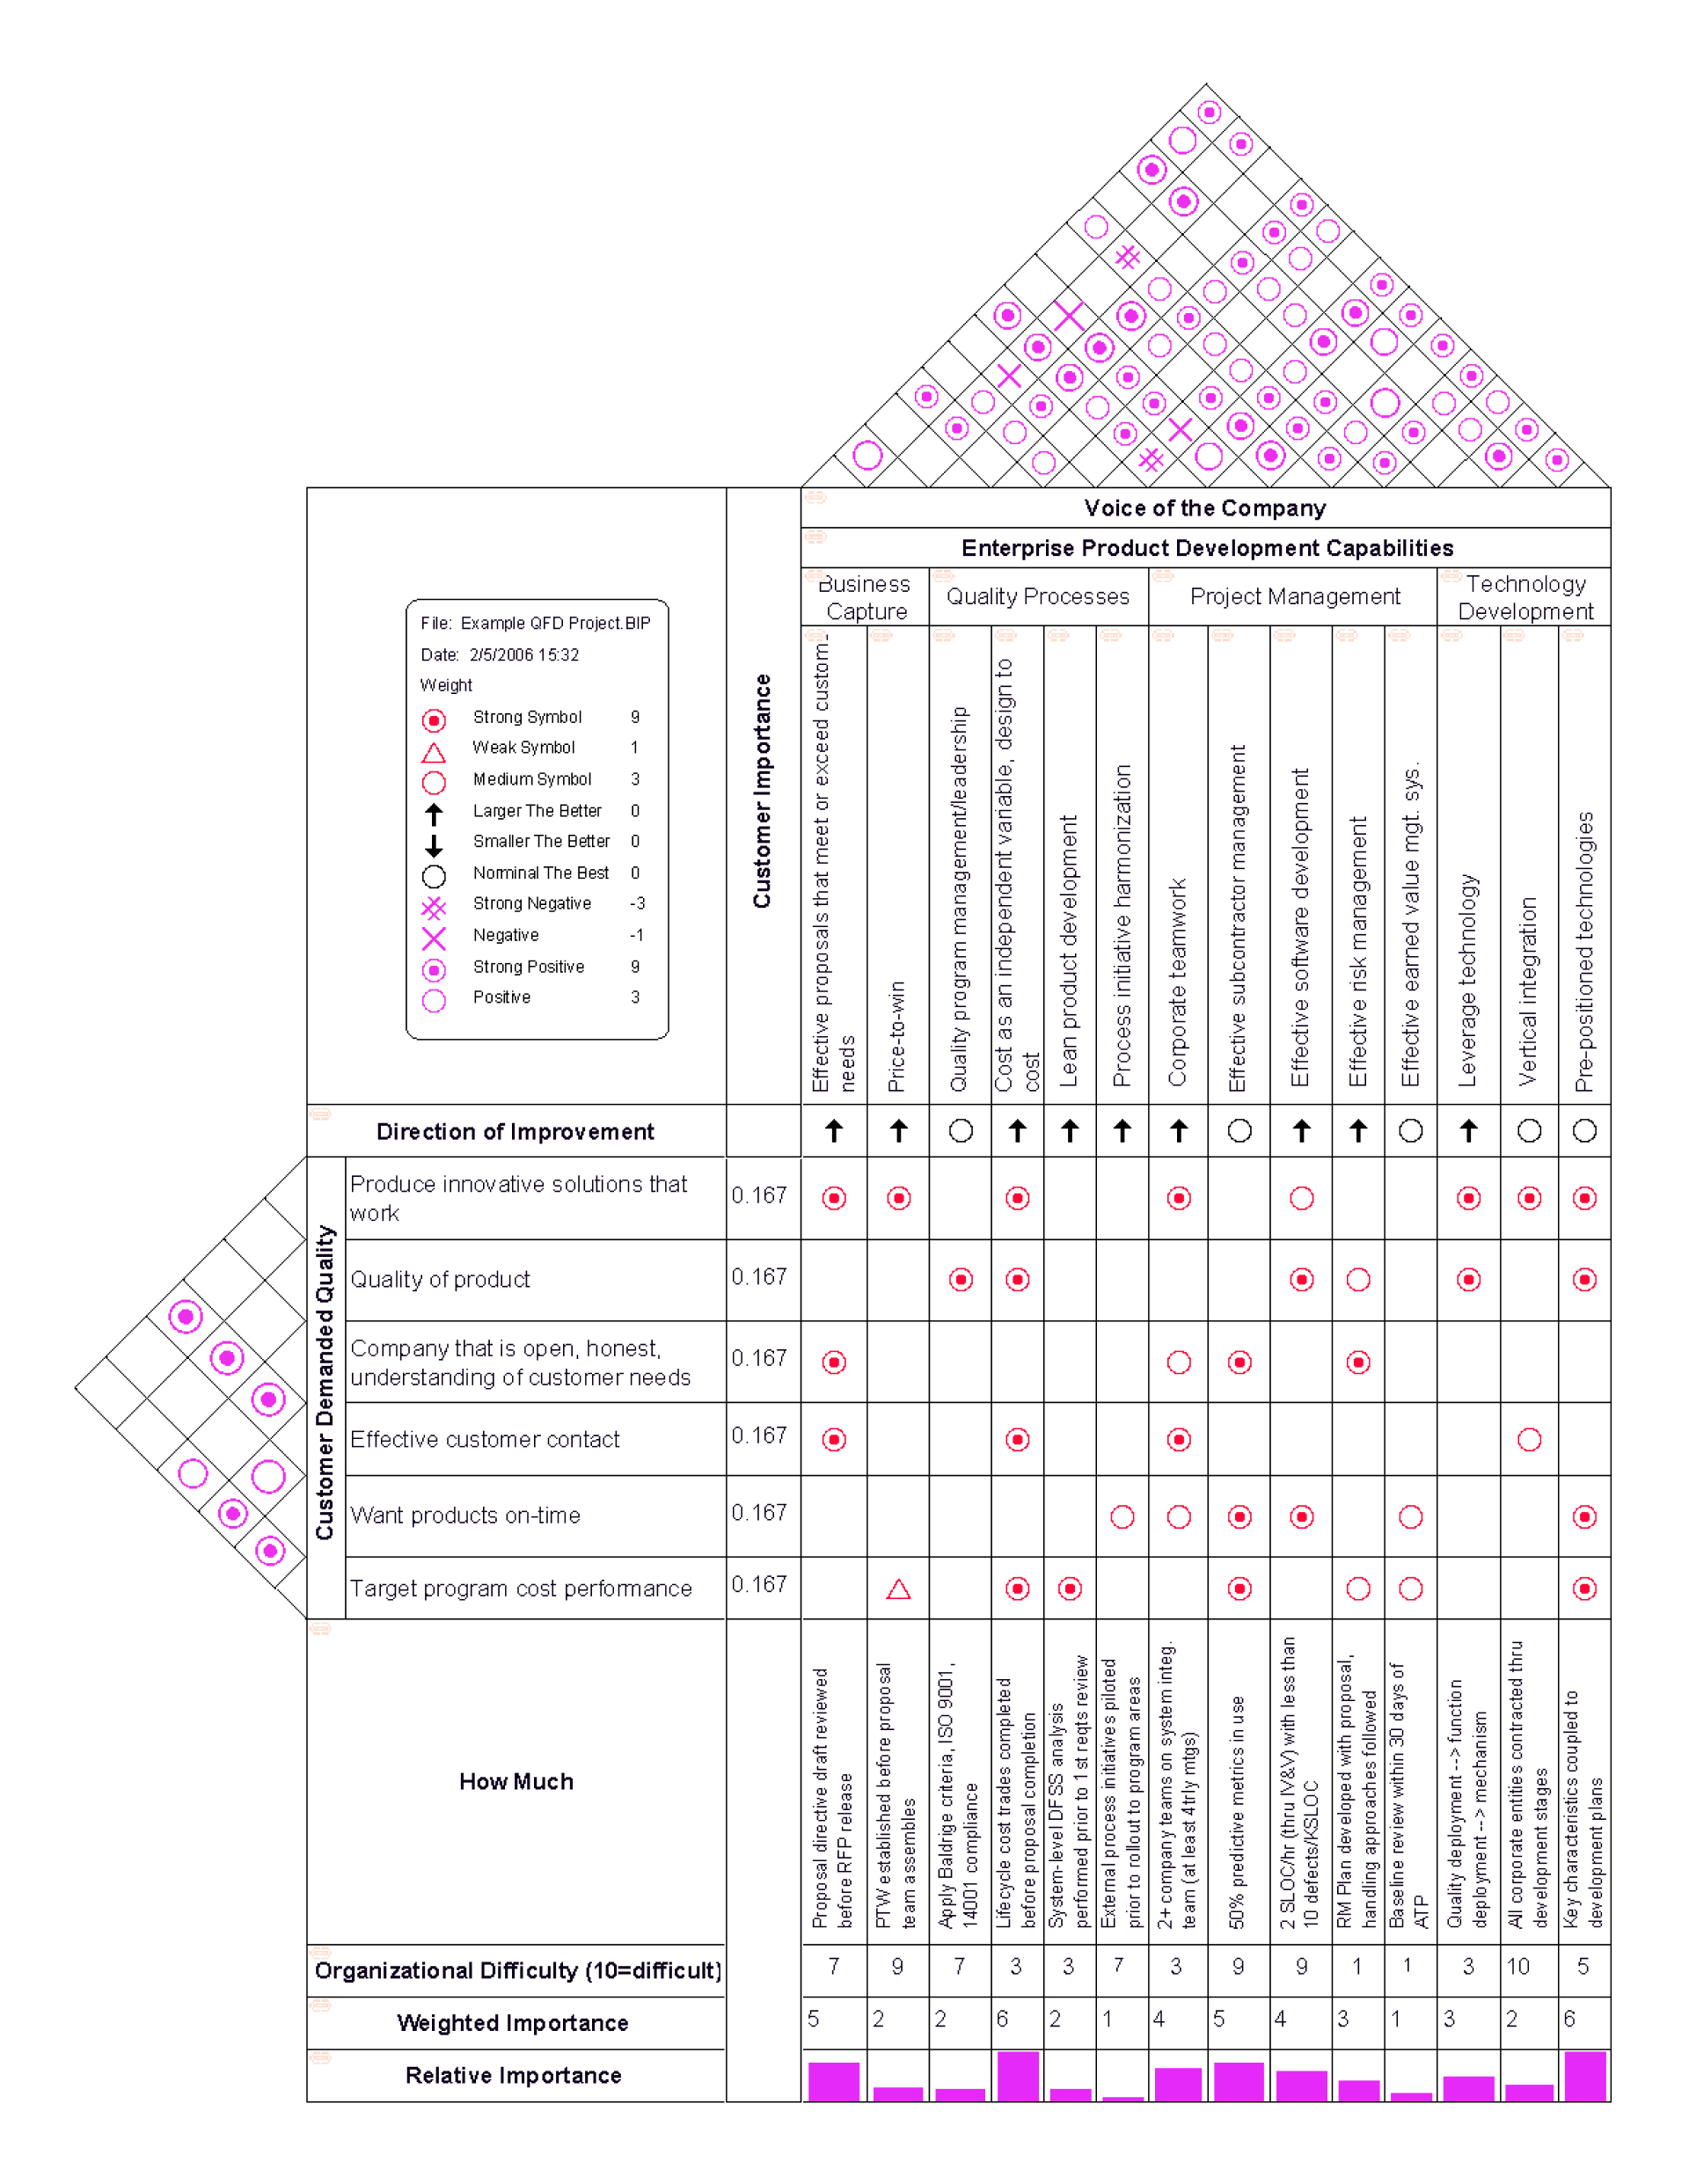 Source: Wikipedia
It’s a very cunning mutation of RICE: we work out how capable a feature is of creating the target qualities of the product, compare that with the labor cost and the mutual influence with other features, and get a priority.
How to use my version of the method
The classical version of the method is, to my taste, overcomplicated and focused on not quite the things a product manager cares about. I use a homemade mutation.
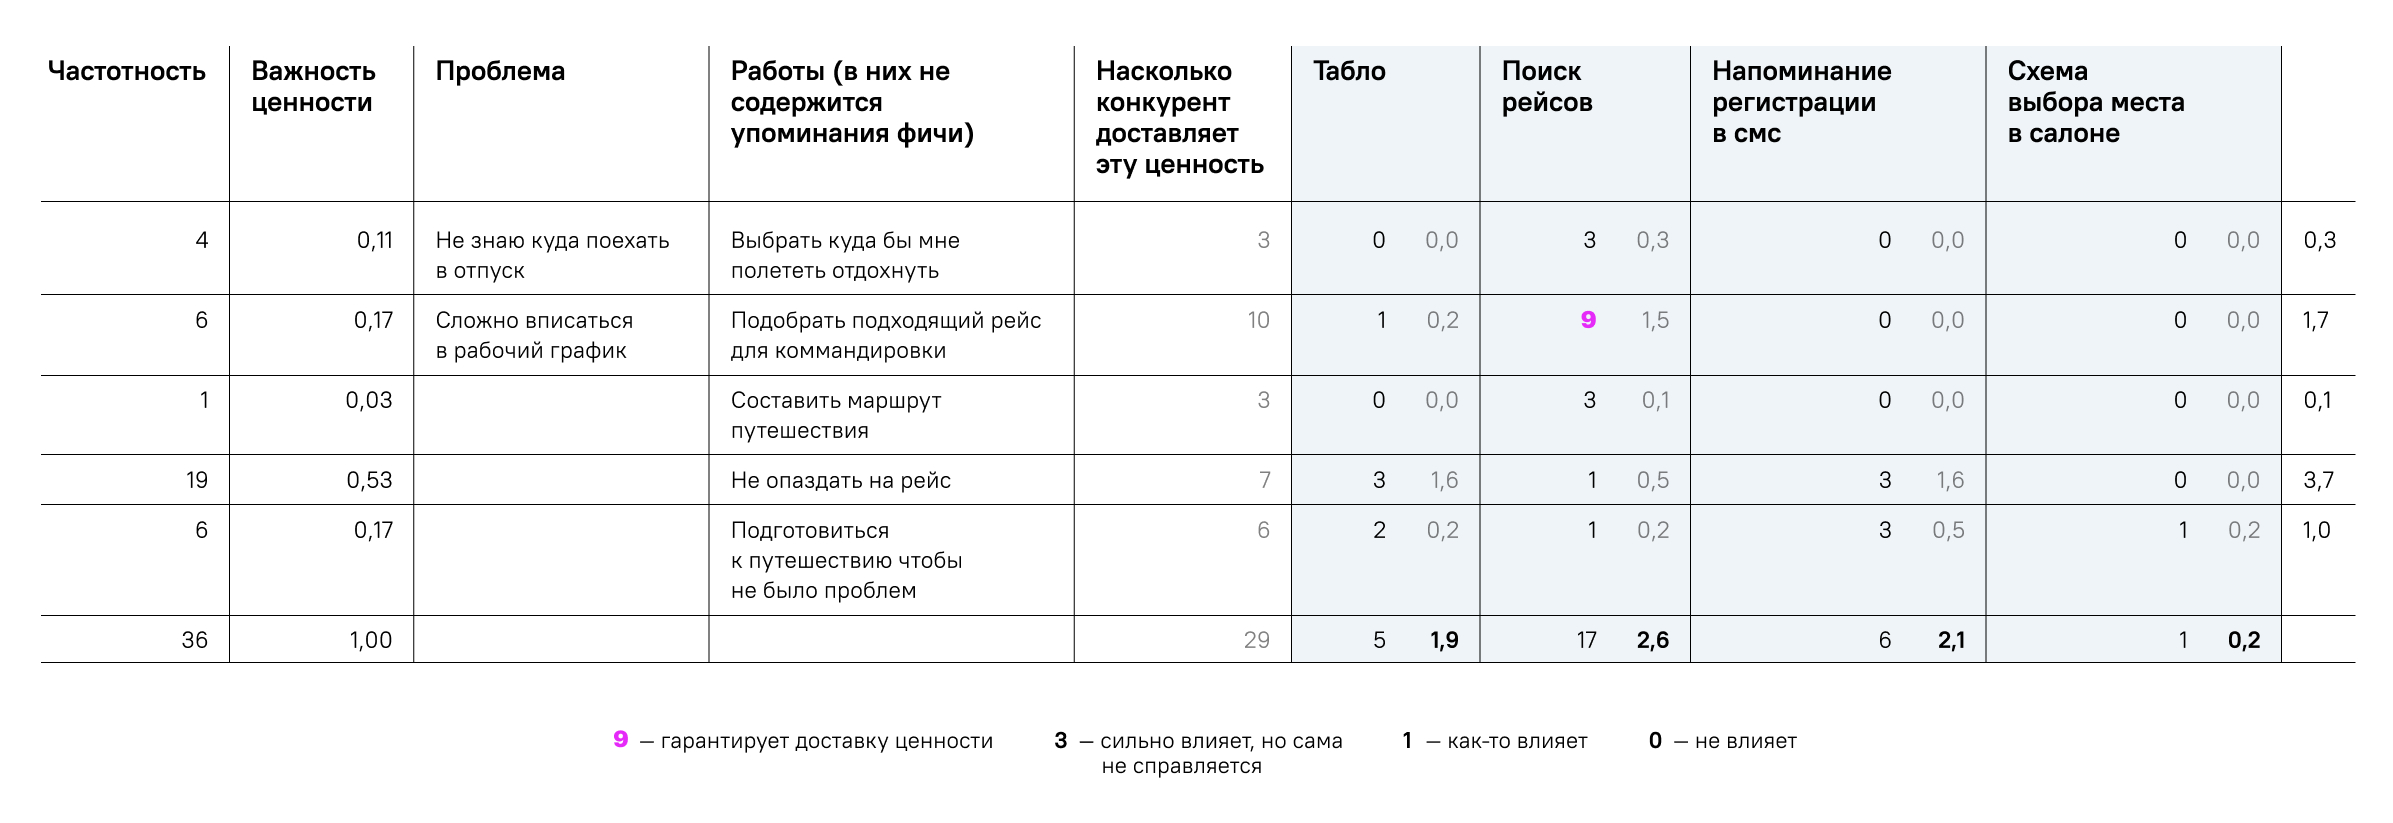
-
We collect the problems clients have told us about. For example, we’re an airline’s website. And our clients’ pains are “I don’t know where to go on vacation,” “It’s hard for me to fit it into my work schedule,” “I’m afraid of missing my flight.”
-
We note the frequency — how many times each problem was mentioned to us.
Here you need to do research and note the real frequency that holds for the chosen client group, otherwise all the results will be by eye.
-
We normalize the frequency so that it sums to one, and get the weight of each pain. Here one is 100%, so each pain is recorded as some percentage of contribution.
-
We reformulate the pain into value by inversion:
- “I don’t know where to go on vacation” = “I need help choosing where to take my vacation.”
- “It’s hard for me to fit it into my work schedule” = “I need to pick a suitable flight for a business trip.”
- “I’m afraid of missing my flight” = “I need to not miss my flight.”
-
We look at how competitors deliver these values. Let’s say they have a departures board, flight search, an SMS reminder about check-in, a seat-selection map for the cabin, and so on. What matters isn’t just the set of features but the specific details of the implementation.
-
We assess how much competitors’ features solve clients’ problems. For this we use a legend:
- 9 — the feature on its own guarantees the delivery of value,
- 3 — has a strong effect, but can’t do it alone,
- 1 — has some effect,
- 0 — no effect.
An important feature of the method: we don’t use intermediate values. If we can say that some property is capable of solving the client’s problem on its own, we put a 9. And if it needs some additional conditions, then however important it may seem to us, we put a 3, not a 5 or a 6.
-
We multiply our score by the weight we determined for each pain in point 3. The result tells us how useful it is to work on a specific thing to solve a specific problem.
-
We sum the column of unit value and get how much this feature affects the delivery of our product’s values overall.
-
What’s left is to compare each feature’s unit value with how much of what we’ll spend to create it. For example, how much time and effort.
As a result, the framework prioritizes clients’ pains and shows which feature will bring the most value given that priority. That’s the one to start with.
An important point: when we gave some feature a nine, we didn’t just assign it a priority, we also stated the requirements for it. That is, to solve the problem of choosing a suitable flight, you don’t need to build just any flight search, but one where booking business trips is convenient. Everything to do with experimental testing, with setting requirements, with cases, we take from the chain: we’re building this feature in order to create this value, which will solve this problem.
When to apply QFD
At early stages of designing a product, QFD helps you understand which problems need solving, dream up features to solve them, and choose which ones to build the product around — that is, to choose the product’s trunk.
QFD applies to mature products too: you simply talk to your users, and you end up with a mile-long list of problems and features that could solve them. QFD will help you understand what to do first.
At early stages it’s the hypothesis of the business’s existence, and at later stages it’s hypotheses about what will affect your business in the future.
The main danger of QFD is that if a product manager tends to slide into featurism (that is, thinking about the product’s functions rather than about people’s behavior), then this system gives them a way to fit the numbers to their favorite features. QFD was made with exactly the opposite purpose — to prioritize values and find ways to achieve them. But it’s easy to abuse.
The link between the goal and the metric
I’ve gone through five different frameworks that help you prioritize on the basis of some metrics. But let’s not forget that a metric isn’t the point of the activity. Any metric can be applied for the wrong purpose. The point of the activity is reaching the business’s goals, and metrics are simply indicators of how close we’re getting to them.
In the end, any prioritization comes down to you moving toward the goal faster. The more clearly you understand your goal and the faster you move toward it, the better.
If you apply the frameworks however “correctly” you like but lose the connection to the goal, it will all be for nothing. And if you clearly see the connection to the goal and move toward it fast, without using frameworks, doing everything your own way — everything will be fine. Unless you got the goal wrong.
How to set goals
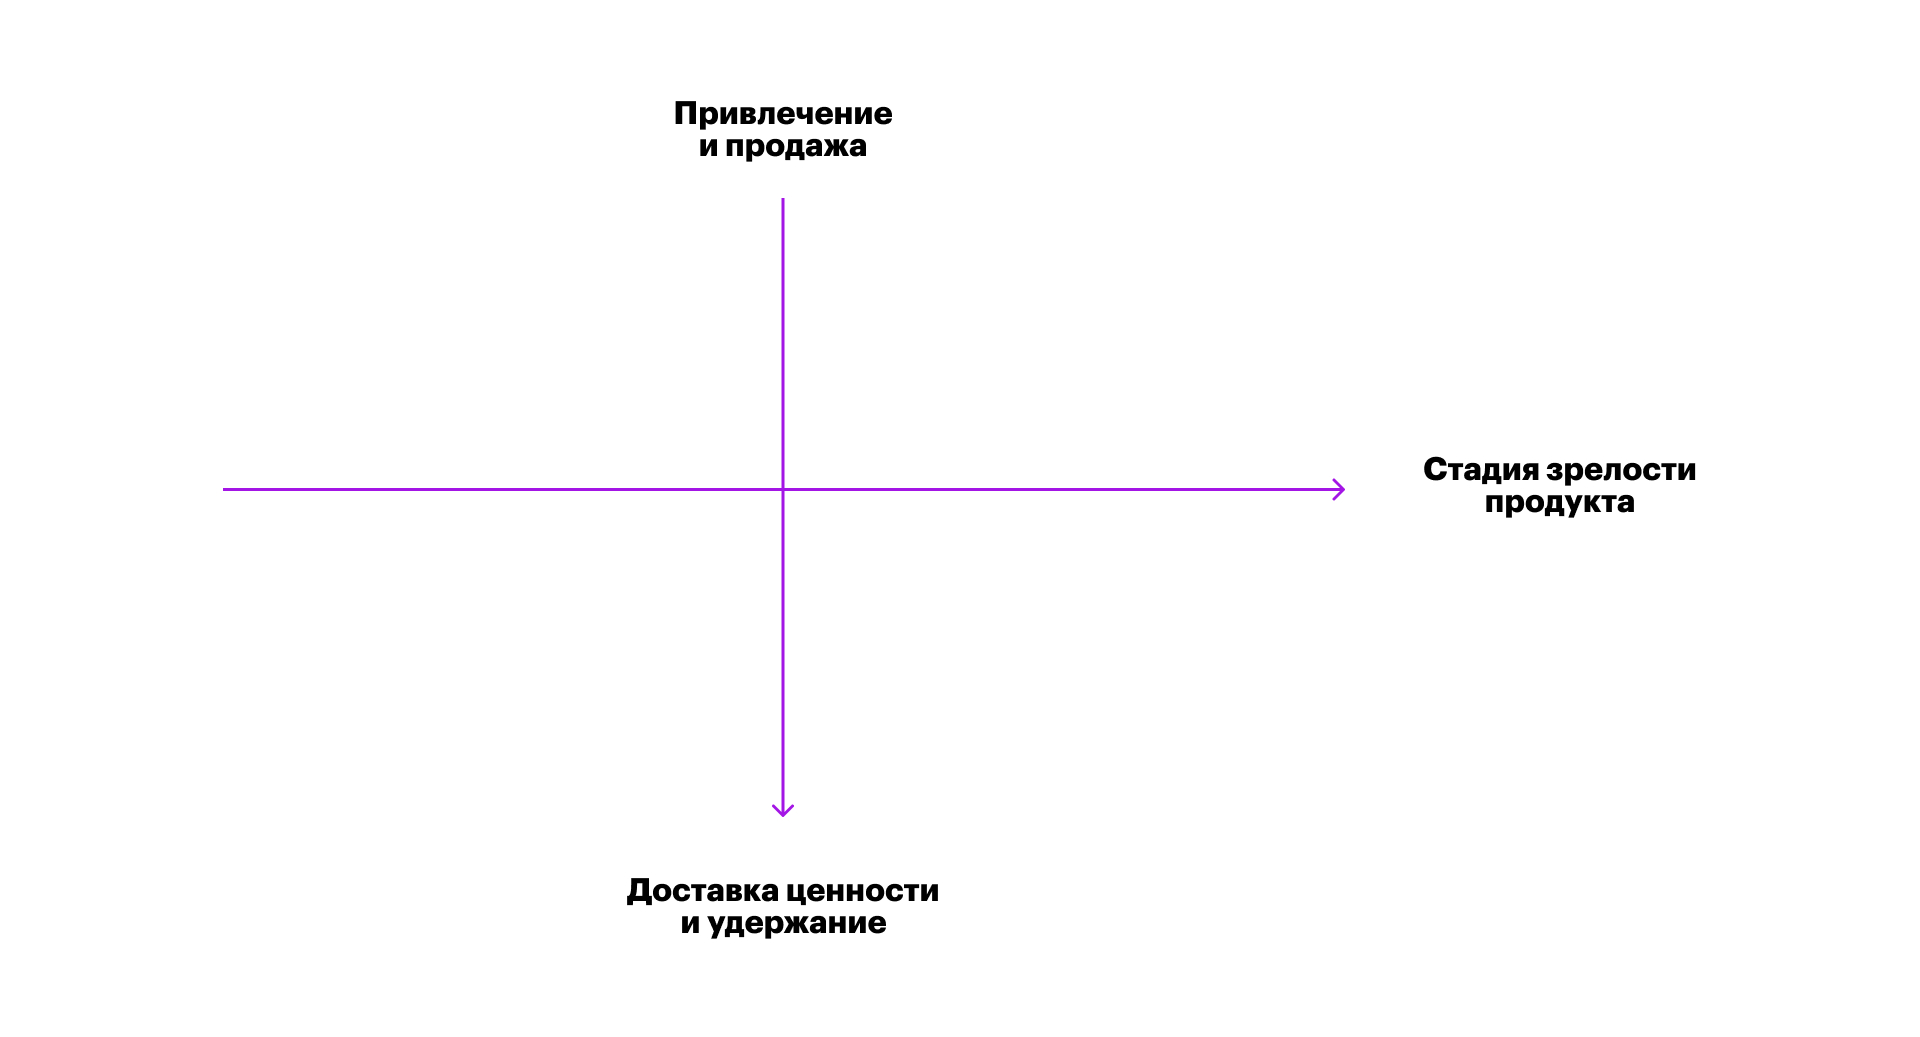
On the chart, the horizontal axis is the product’s stage of maturity: from an idea to a group of products — a big business that steadily brings in money. In between are the stages: first sales, market fit found, sustainable growth, cash cow.
And the vertical axis is the AAARRR sales funnel: Awareness, Acquisition, Activation, Retention, Referral, Revenue. At any given moment there will be goals arranged somewhere in this space that will mean something within this whole story.
It seems that all of a product’s main goals live somewhere in these quadrants.
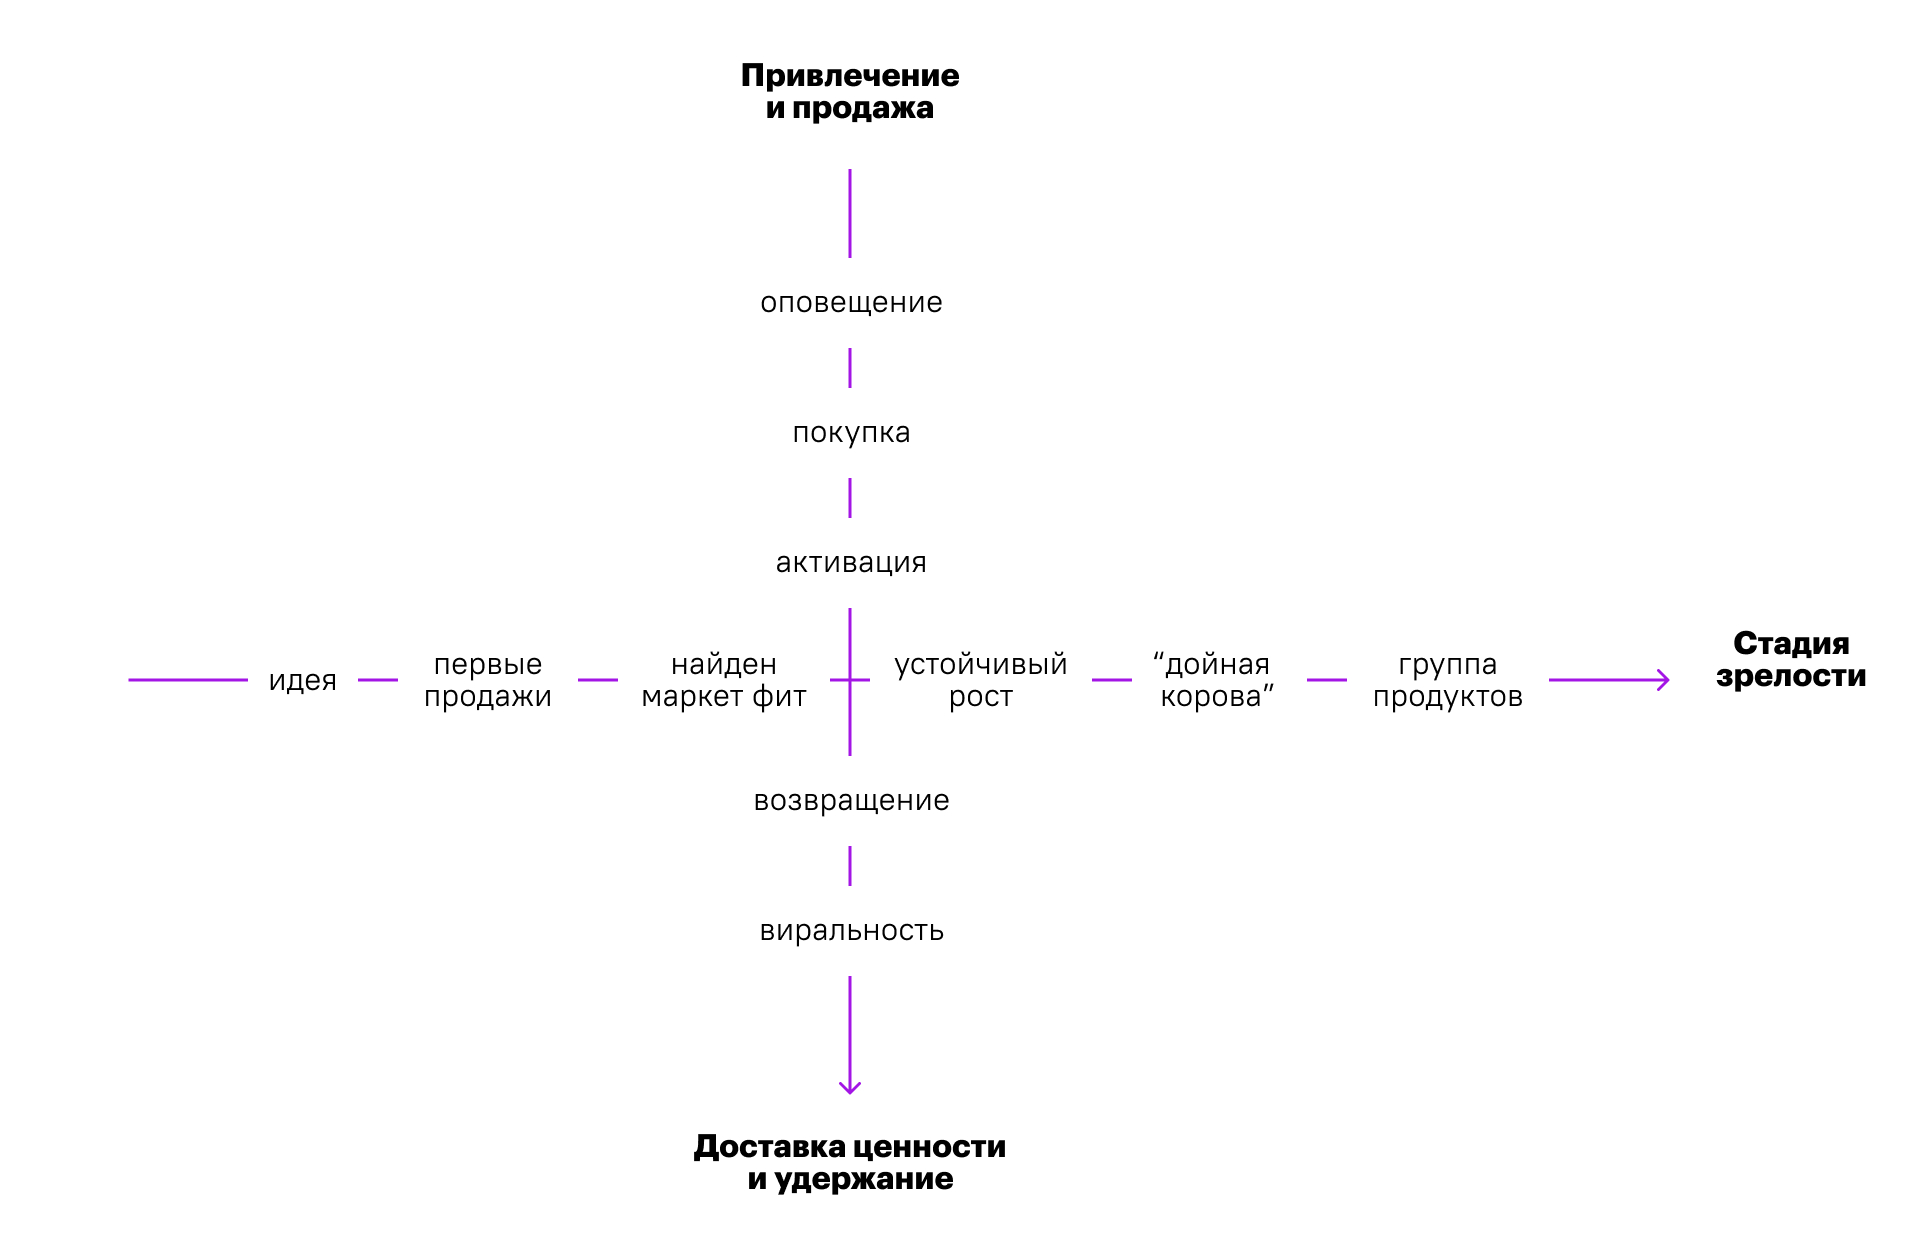
At different times different things can hurt, for example: nobody knows about us, our conversion to purchase is low, clients buy but don’t use, clients use but don’t like it, clients like it but our unit costs are too high.
It’s impossible to work on everything at once. At any given moment there’s still one narrowest bottleneck. You can find it with TOC.
Unit economics
Unit economics is the economic way of writing down the same thing. In TOC we optimize the flow, which you can look at in different ways. But one of the most convenient cross-sections is the user’s life cycle expressed in terms of effect on money.
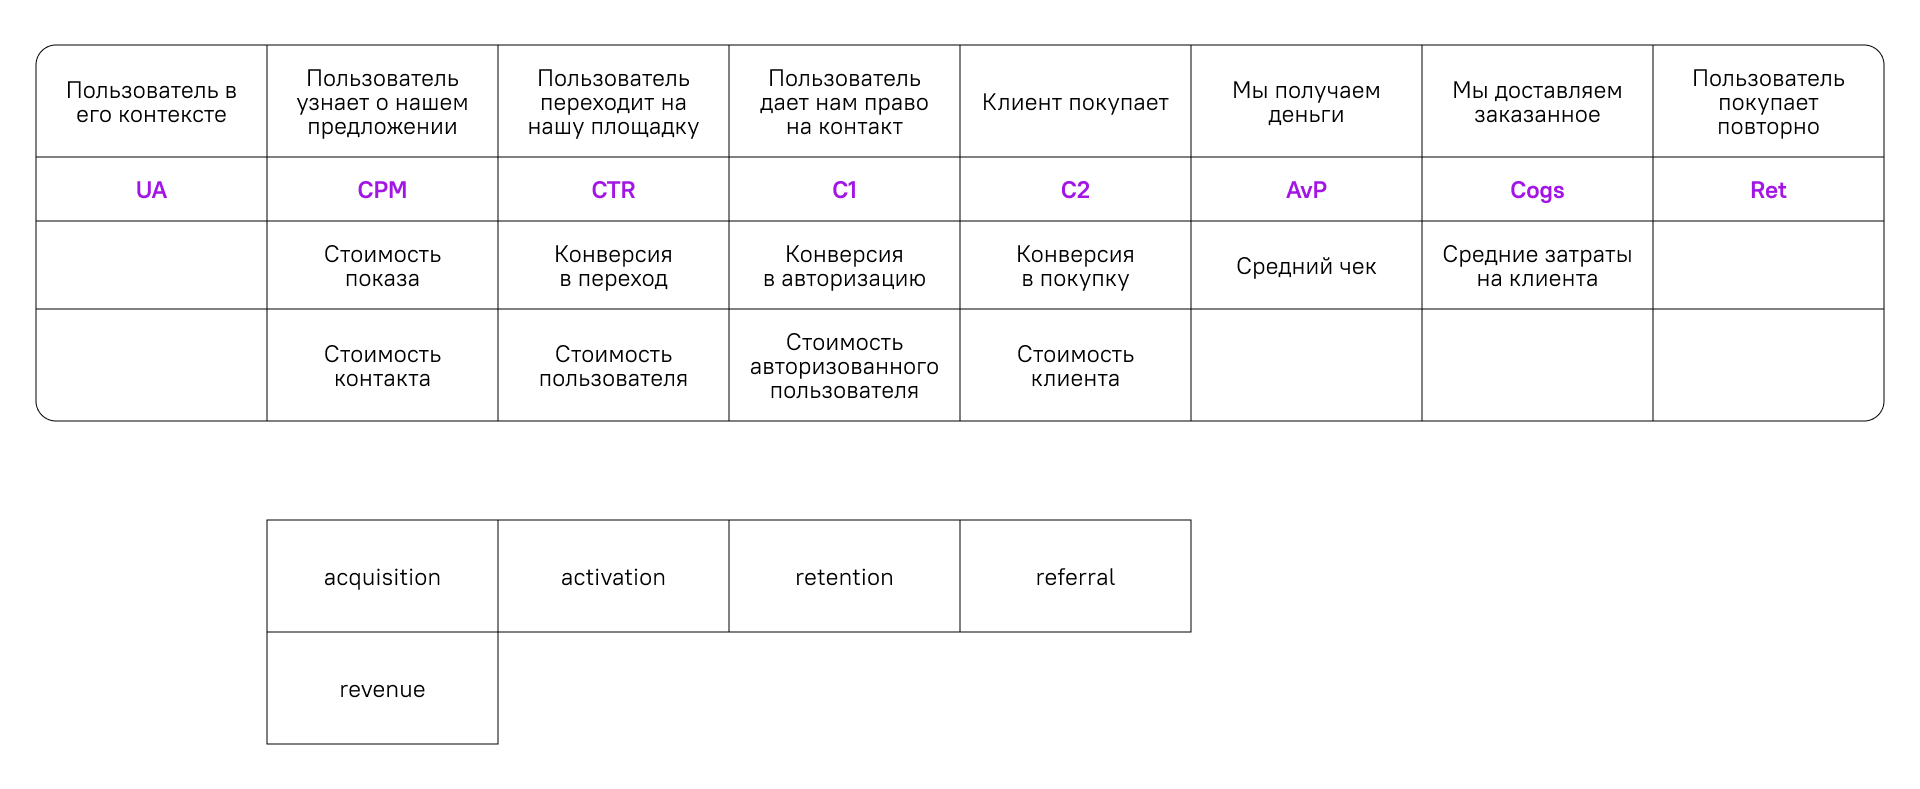
The generalized scenario for e-commerce goes like this:
- We have some number of users.
- They find out about our offer, and we pay some amount for that awareness.
- Some number of users interact with us somewhere, on the site, say.
- Revenue appears.
- Some number of users buy again.
- Some further number convert into the next client.
Unit economics answers the question of what we’re scaling: profit or loss.
If a step suddenly sticks out when you’re working with funnels, that’s unit economics telling you that we’re pouring water into a leaky bucket, because we’re trying to sell a service that doesn’t satisfy clients. Until we fix that, we’ll always be losing money. Conclusion: first you have to sort out value delivery, and only then invest effort into everything else.
Unit economics is an economic model that shows how users behave in economic terms and where in the scenario the sharpest problems are.
What does that mean for prioritization? You compare all the hypotheses, guessing which part of the unit economics an initiative will affect, and choose the ones that give more effect on gross profit.
A bit of project management
Up to this point we’ve been talking about how to optimize the flow of value delivery — that concerns the logic of the product. There’s a backlog of sensibly described tasks that we’ve ranked by importance — you take the task at the top of the list and do it.
That approach maximizes the chance that we’ll work on an important task sooner, but it doesn’t answer questions like: when will the whole product be finished? will we make it to launch before the season starts? how much will it cost? how will we measure the product’s quality, and what quality are we trying to reach in the first place?
This is where practices of managing priorities appear that come not from the logic of the product but from the logic of the project.
A project is when we’re trying to reach a result described in the initial statement while fitting within the boundaries we’ve been given in terms of quality, deadlines, feature set, and cost.
I think someday this will be proved as a theorem, but for now it’s a lemma, and it goes like this: if you fix a product’s feature set, deadlines, and quality criteria before development starts, then you can get any benefit from operating the software you’ve written only if you’re reproducing software that already works under identical conditions by that point.
And, well, there are situations where you can’t ignore project management logic. For example, if you work in a publicly funded organization. Then you have to put up with certain constraints.
What you can and can’t nail down
I have a heuristic: if out of the four factors — speed, cost, feature set, and quality, given in terms of user behavior — we’ve fixed more than two by requirements, then things are bad. We’ve left ourselves too little freedom. The manager has no instruments of control. If something goes wrong, we won’t be able to react and we’ll blow the project. And something will definitely go wrong for us, since we’re building a new innovative business and the uncertainty is high.
If only the feature set is nailed down
Then there’s a big question: are we even making a product. Probably we’re far from the first on the market and are creating the 916th shawarma kiosk, which will be just like the 915th.
We may have a hypothesis about how a specific set of functions can change users’ behavior. But if we haven’t implemented that set of functions yet and haven’t observed that behavior occurring, then we don’t know for sure what the feature set will be until we observe how a client uses it in the value delivery scenario.
If you think you know which functionality will work, then you’re either a prophet or you’re not doing innovation. But most often — you’re just hallucinating. The feature set in an innovative business isn’t worth fixing.
If only the product’s quality is nailed down
Quality isn’t “make it good, no, make it excellent.” It’s a concrete property, some specific quality. You can describe quality at the start only if you already know this market well. For example, you work in the consumables market and you know that retention is your main metric. Or you work in the education market and you know that your main metric is completion rate — the percentage of clients who finish their studies. If that’s the case, then that quality becomes your priority. Which means you’ll have a series of experiments aimed at improving that quality. But most likely you’ll have that understanding of the market niche not at the start, but in the middle, or only once you’ve already found your connection to the market.
If money and/or time are nailed down
This is a good case, because within these constraints the feature set isn’t fixed. We can use the critical path method and determine what needs to be done now to get the best performance before the investment and the deadline run out.
What to do if the product is described as a technical specification
Try to take the shortest road to the first benefit, given either in terms of money or in terms of feedback from use. Reprioritize what you’ve been handed so that you do first whatever will visibly change client or internal processes.
If you can’t organize the work so that you can see how the processes change, then you’re not doing a product story, and this book isn’t for you. For how to do projects, read Scott Berkun — he’s good.
The critical path as a prioritization method
The critical path is a long list of tasks that necessarily have to be done in sequence. If you’re late finishing one task — the whole project’s deadlines slip.
When you identify such a list, it’s important to try to hack it — to challenge whether you really need to do that many steps. In this case it’s worth prioritizing from the blockers. A blocker is something without which the scenario doesn’t run at all.
It’s important to throw everything except the blockers out of the critical path, roll the product out into interaction with clients in its most ascetic state, and get a machine for testing hypotheses. And only after that go back to optimizing the flow and finish the rest, to improve the metrics and reach the goal.
But that will no longer be project management, it will be product management.
Prioritization at later stages of product development
Once you’ve launched something, you have to develop it, but you also want to launch the next big feature, so a second stream of development appears. The first is busy supporting and developing what you’ve already built. The second is busy testing new hypotheses. Good practice: as many teams as there are development streams. The support team prioritizes bugs and wishes, and the development team works on new hypotheses.
A critical bug
If there’s a single team, everything is prioritized in one stream. With one exception — critical bugs. If there’s a critical bug in production, then every encounter it has with a client leads to a loss of money. An error in a transaction, for instance. A critical bug has preemptive priority. If it happens, we drop everything and fix it. Critical means our business is rapidly losing money right now because of an error in production.
Mainline cases first
There’s a rule: you can’t let rare cases discriminate against the mainline ones, the ones important to the main flow of clients. A minority mustn’t impose behavior changes on the majority. When you make things better for an edge case, check that you’re not making things worse for the main users. Better yet, at the prioritization stage, ask yourself where you even got the idea that this is important. RICE will help you here. Remember that it can also have negative values.
Clearing the moss
When the business survives to the “market fit found” moment, you need to start setting aside time for cleaning. If you only work on mainline scenarios and critical bugs, then after a while everything starts growing over with moss: the interface loses its relevance, return rates fall. Tasks that simply improve the user experience also need to be done.
A feature’s life cycle
-
We came up with and described the idea.
-
We prioritized it — worked out when we’ll take it on.
Many people think that when we talk about priority, we mean development priority. And that the slowest guys in the chain are the programmers, and there are never enough of them for everyone. That’s not true.
We’re not prioritizing the writing of software, we’re prioritizing a change in the behavior of a target person: external or internal user. So in prioritizing a feature you need to take into account not just that the programmers will write it, but that everyone who will encounter this feature in their work — production people, sales people, lawyers, marketers, for example — understood what they need to do so that the changes you’re planning to introduce actually get introduced. And did it. And saw how users’ behavior changed.
Very often it turns out that the scarcest resource isn’t the programmer at all, but, say, the product manager.
-
We created and tested an alpha version on a test group.
-
We created and tested a beta version on an unlimited number of unprepared users.
-
We achieved value delivery. The custdev people looked at how the feature works in production, analyzed the user experience, and concluded that everything works.
-
We handed it over to support, which will now handle the feature’s backlog so that it performs better, and will fix bugs.
Problems
If we have a clear system of goals and metrics and we haven’t gotten into local optimization, then on the whole everything is clear. You have to analyze which interventions require little effort and strongly affect the speed of getting closer to the goal, and take them on. That is, pick the low-hanging fruit that affects the bottleneck. But there are two hard cases.
The conflict between user happiness metrics and business ones
There are features whose introduction will definitely make the user’s life better, but it’s not a given that your economics will be better off for it. Often it’s the opposite: the user’s life gets better at your expense, and locally, from a cash flow standpoint, things get worse for you.
You may think that grateful users will come back, so the business will get better thanks to retention. On the whole that’s a very sound position. People sometimes say that the most important business metric is repeat sales, or user loyalty. So having the creation of value as your goal is a good thing. Although in the moment it may mean you’re spending effort on something that will bring money later rather than now. To understand that, you need to have metrics of client happiness.
But then the question arises: **how do we know this set of metrics is the right one, given that we haven’t been to the future? ** How do we make sure that by creating happiness for people we’ll really make money. To be honest, I have no answer other than to believe in that outcome. And here we come to the second problem prioritization can’t handle — how do you form a vision worth believing in?
The conflict between short metrics and strategic vision
Suppose that within your vision, to change people’s behavior you need to create something radical: long, expensive, requiring R&D and a series of experiments. Nothing like low-hanging fruit at all, but promising a revolution.
For example, you want to apply artificial intelligence to extracting data about the state of warehouse stock, so that any supply manager always knows not only the assortment of every enterprise on the market, but also availability and price. How do you do that? Nobody knows. But it will cause a sensation in the market. So you plan to invest in the search for a way until you kill yourself.
On one hand, the methods I’ve talked about — TOC, and RICE, and the riskiest hypothesis — may say this is a good scenario. And the prize is so gigantic that you can afford to bury a lot of investment here.
But here you’ll run into a real problem, and I honestly have no instrument for solving it. The problem is this: how do you understand whether this really is a deep, good vision. What if it’s our boss’s nonsense and we’re doing something pointless?
We’ve all seen plenty of people who think they’re visionaries, but they’re fools. They came up with rubbish, buried years in it, and then it turned out it doesn’t work. But some of us have had the experience of dropping our idea, having decided it couldn’t succeed, and then other guys built their unicorn in the same spot.
Prioritization won’t help you answer that question. It will help you take steps that bring the target picture closer, but it won’t insure you against betting on the wrong thing in the global sense.
You can simply not do deep vision — that’s a good way not to lose money. But then you most likely won’t manage to change the market in a big way either.
If you have decided to make a big bet, though, there’s one reliable symptom. A visionary is a person whose vision, for some reason, can be believed. So they definitely need to have expertise in the subject area they’re working in. And there need to be people who believe in that picture. If that’s not the case, then almost 100% nothing good will come of it.
Conclusion
In this article we’ve gone through several blanks for prioritization models. But I want to say once more — don’t try to treat them as canon, do everything to fit your own task. You need your own model, which is good only insofar as it speeds up your product’s movement toward your goal and has predictive power. If a framework doesn’t help you move toward the goal — forget it and throw it out. It’s not about the framework, it’s about the movement.