JetStyle's Unit Economics Calculator: Why You Need It and How to Use It
Ten years ago two things happened to me almost at once: I was asked to design a board game about unit economics, and I became product director at Rideró and started using unit economics in practice. It's the most effective tool there is.
Very briefly, what unit economics is and how it differs from performance marketing
If you’re completely unfamiliar with the concept of unit economics, we recommend the material written by Ilya Krasinsky and Daniil Khanin. The abbreviations and notation in their methodologies differ. Here you’ll find more references to their work. Our article is about one specific instrument — the calculator.
So, unit economics is an approach in which you compare all the costs tied to a specific customer against all the revenue that customer brought you. And you understand what it is you’re scaling — profit or loss. It isn’t the whole economics, of course, because we’re not counting fixed costs. In its simplest form the model is described by an elementary formula:
(average check − average cost per customer) * repeat purchases − customer acquisition cost
Generally it looks a lot like performance marketing, doesn’t it? That’s how it looked to me at first too. But here’s the difference: once you learn to think in terms of unit economics, you realise that every decision anyone (designer / marketer / product director / sales director / lawyer / head of production / whoever else) makes in the product is made purely so that something in this formula changes. And besides that, most of those changes have a dark side too: for example, yes, captain, if you raise the check, conversion may drop.
And once you understand that, it becomes much easier to make decisions about tooling. Unlike performance marketing, the instruments here are tied not just to the cost of a lead, traffic availability and conversion, but to every process in the company. Since we’re a production studio, this knowledge is very valuable for us (and for our clients), because it lets us discuss price in terms of payback rather than in terms of cost. And that in fact makes the sale easier and lengthens the happy life we share with the client.
In short, having designed a board game and worked as a product director, I learned to see the economic notation of any scenario. And yes, by the way, from a UX point of view unit economics is just a user scenario drawn in Excel instead of Figma.
Why did we need to build a calculator?
There’s one problem: if you haven’t worked as a product director yet, reasoning along these lines is somewhat harder for you than for me. And in particular it was harder for our managers and designers. So we made a calculator you can use right there in a client meeting to discuss how this website / app / ad channel / creative / intranet / any other idea is going to pay for itself.
Here’s how our calculator works, using ecommerce as an example.

We suggest entering the basic economic parameters of any such project:
-
How many available users you have in the acquisition channel, UA;
-
How much a single visit costs you, CPC;
-
How much a conversion into the right to contact them costs you, C1;
-
How much a conversion into a purchase costs you, C2;
-
What your average check is, AvP;
-
What your average costs are (this covers everything you spend as a result of the purchase, including the cost of the sale, but not including acquisition cost), COGs;
-
How many repeat purchases you’ll get, Ret.
I’ll say upfront that we had an extensive internal debate about what all of this is canonically correct to call in English. But honestly, that isn’t very interesting — what matters is understanding what it means in actual reality.
Usually, before we try to put data into the calculator, a conversation like this happens between us and the client:
— Yes, but we don’t have that data! — No problem, let’s just make a rough guess to start with. What industry are you in? Right, I’ve looked it up, in your subject area an average click costs this much. Let’s be optimists and say conversion will be 4%… How much do people usually pay you? — … — Well, let’s ask your commercial director, he’ll name some approximate figure. And so on.
As a result we understand how much can be earned at all, and more importantly, how sensitive our model is to fluctuations. For example, if a step of half a percentage point in conversion knocks you out of payback, you can only afford very, very price-controlled channels, and it’s ultra-important for you to track any change in the conversion funnel. Or the other way around: when you’re selling a high-margin product, you shouldn’t limit yourself to instruments that are cheap per unit. It becomes clear when — and whether — it’s worth investing in developing or redesigning a website or app at all. And sometimes it turns out that what you need to develop isn’t front-end but back-end interfaces, because the source of innovation lies in raising margin by making the process cheaper.
By the way, a couple of words about innovation. Unit economics turns the word “innovation” from a buzzword into concrete knowledge. It’s the answer to the question of how to make one of the key processes of the business cheaper. And, importantly, of how to find those key processes in the first place.
Moving on. Once you’ve thrown your metrics into the calculator, it will show you roughly this:
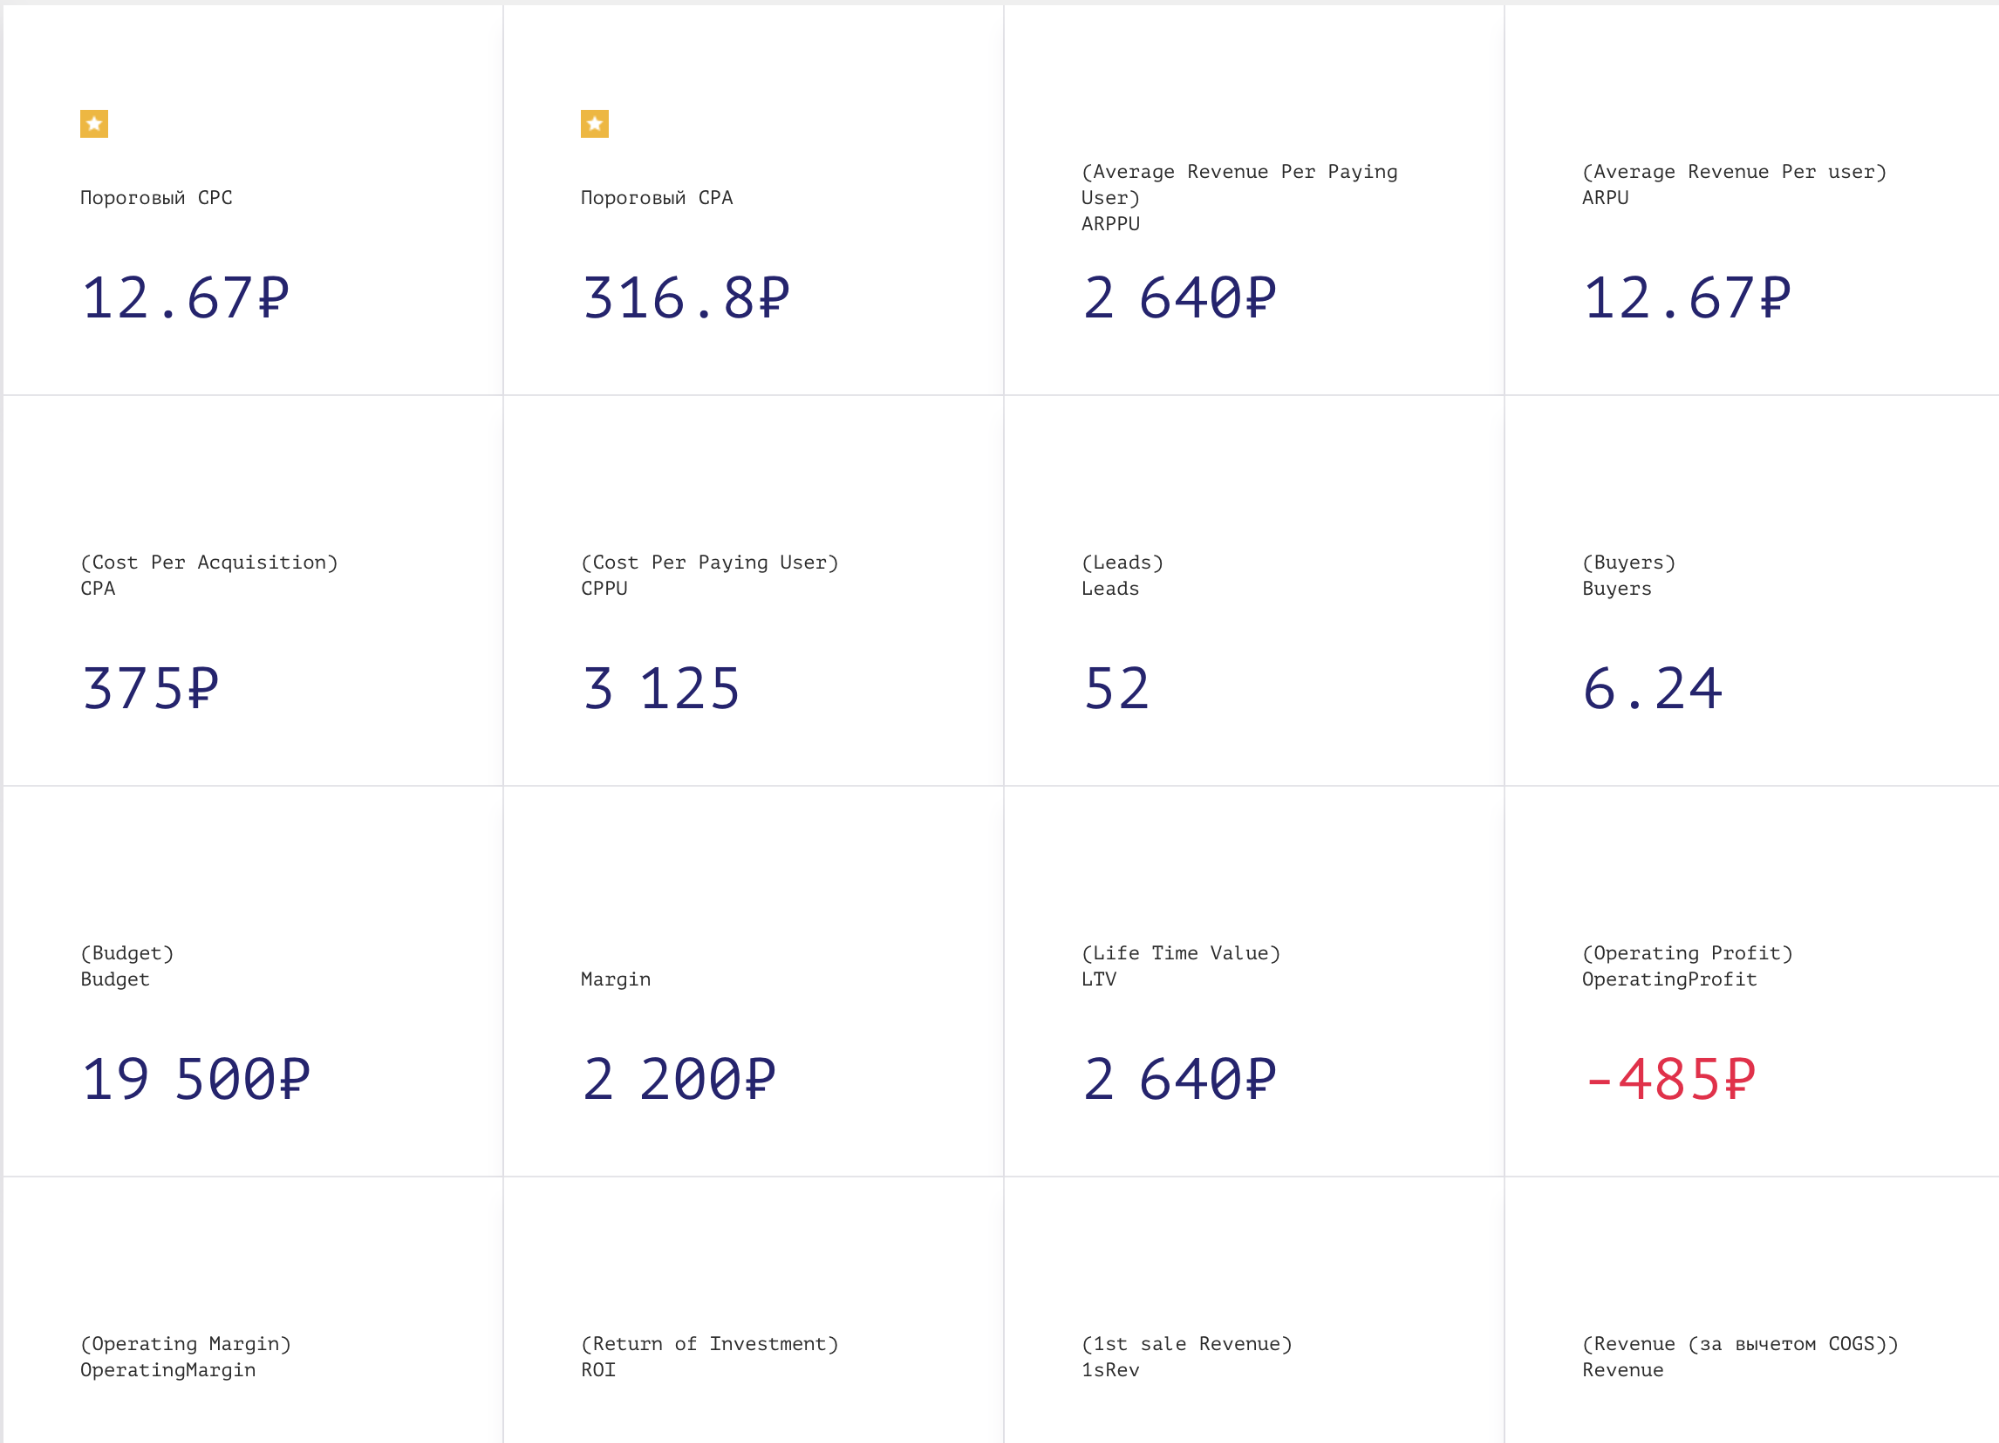
This is a collection of the main metrics that are worth discussing with a client. You could write a separate article about each one, but we’re not going to do that right now, obviously.
And yes, there are other formulas too. For example, if you’re an advertising publication and you sell access to an audience. Or you have an app and the sales happen inside it. Or something else. They’re all easy to build in Excel, and one day our calculator will learn to count them. And yes, in stories like that there are often many more extra parameters, and the numbers aren’t typed in by hand but pulled from CRM, GA, your production ARMs and so on.
Our calculator is a simple instrument for discussing quick starting hypotheses. It lives here. Right now we’re working on its second version, so if there’s a feature you’re missing, now is exactly the time to ask us for it. After using the current version first, of course :–) You can write to kulakov@gmail.com.
To illustrate how the calculator works, we asked our digital strategist Evgeny Kuznetsov to model several cases.
Case 1. A diaper online store
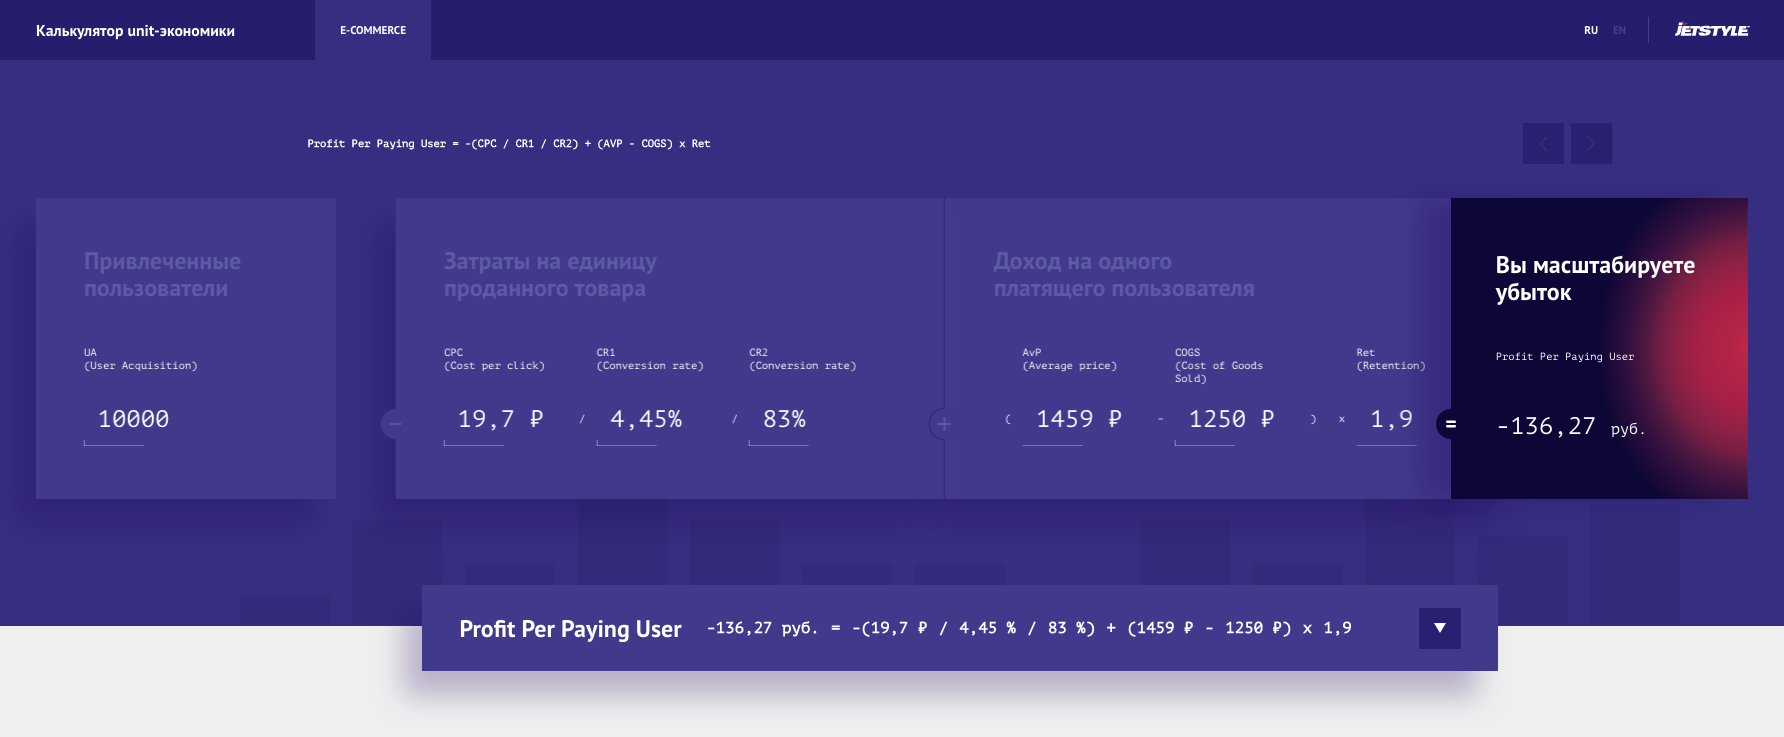
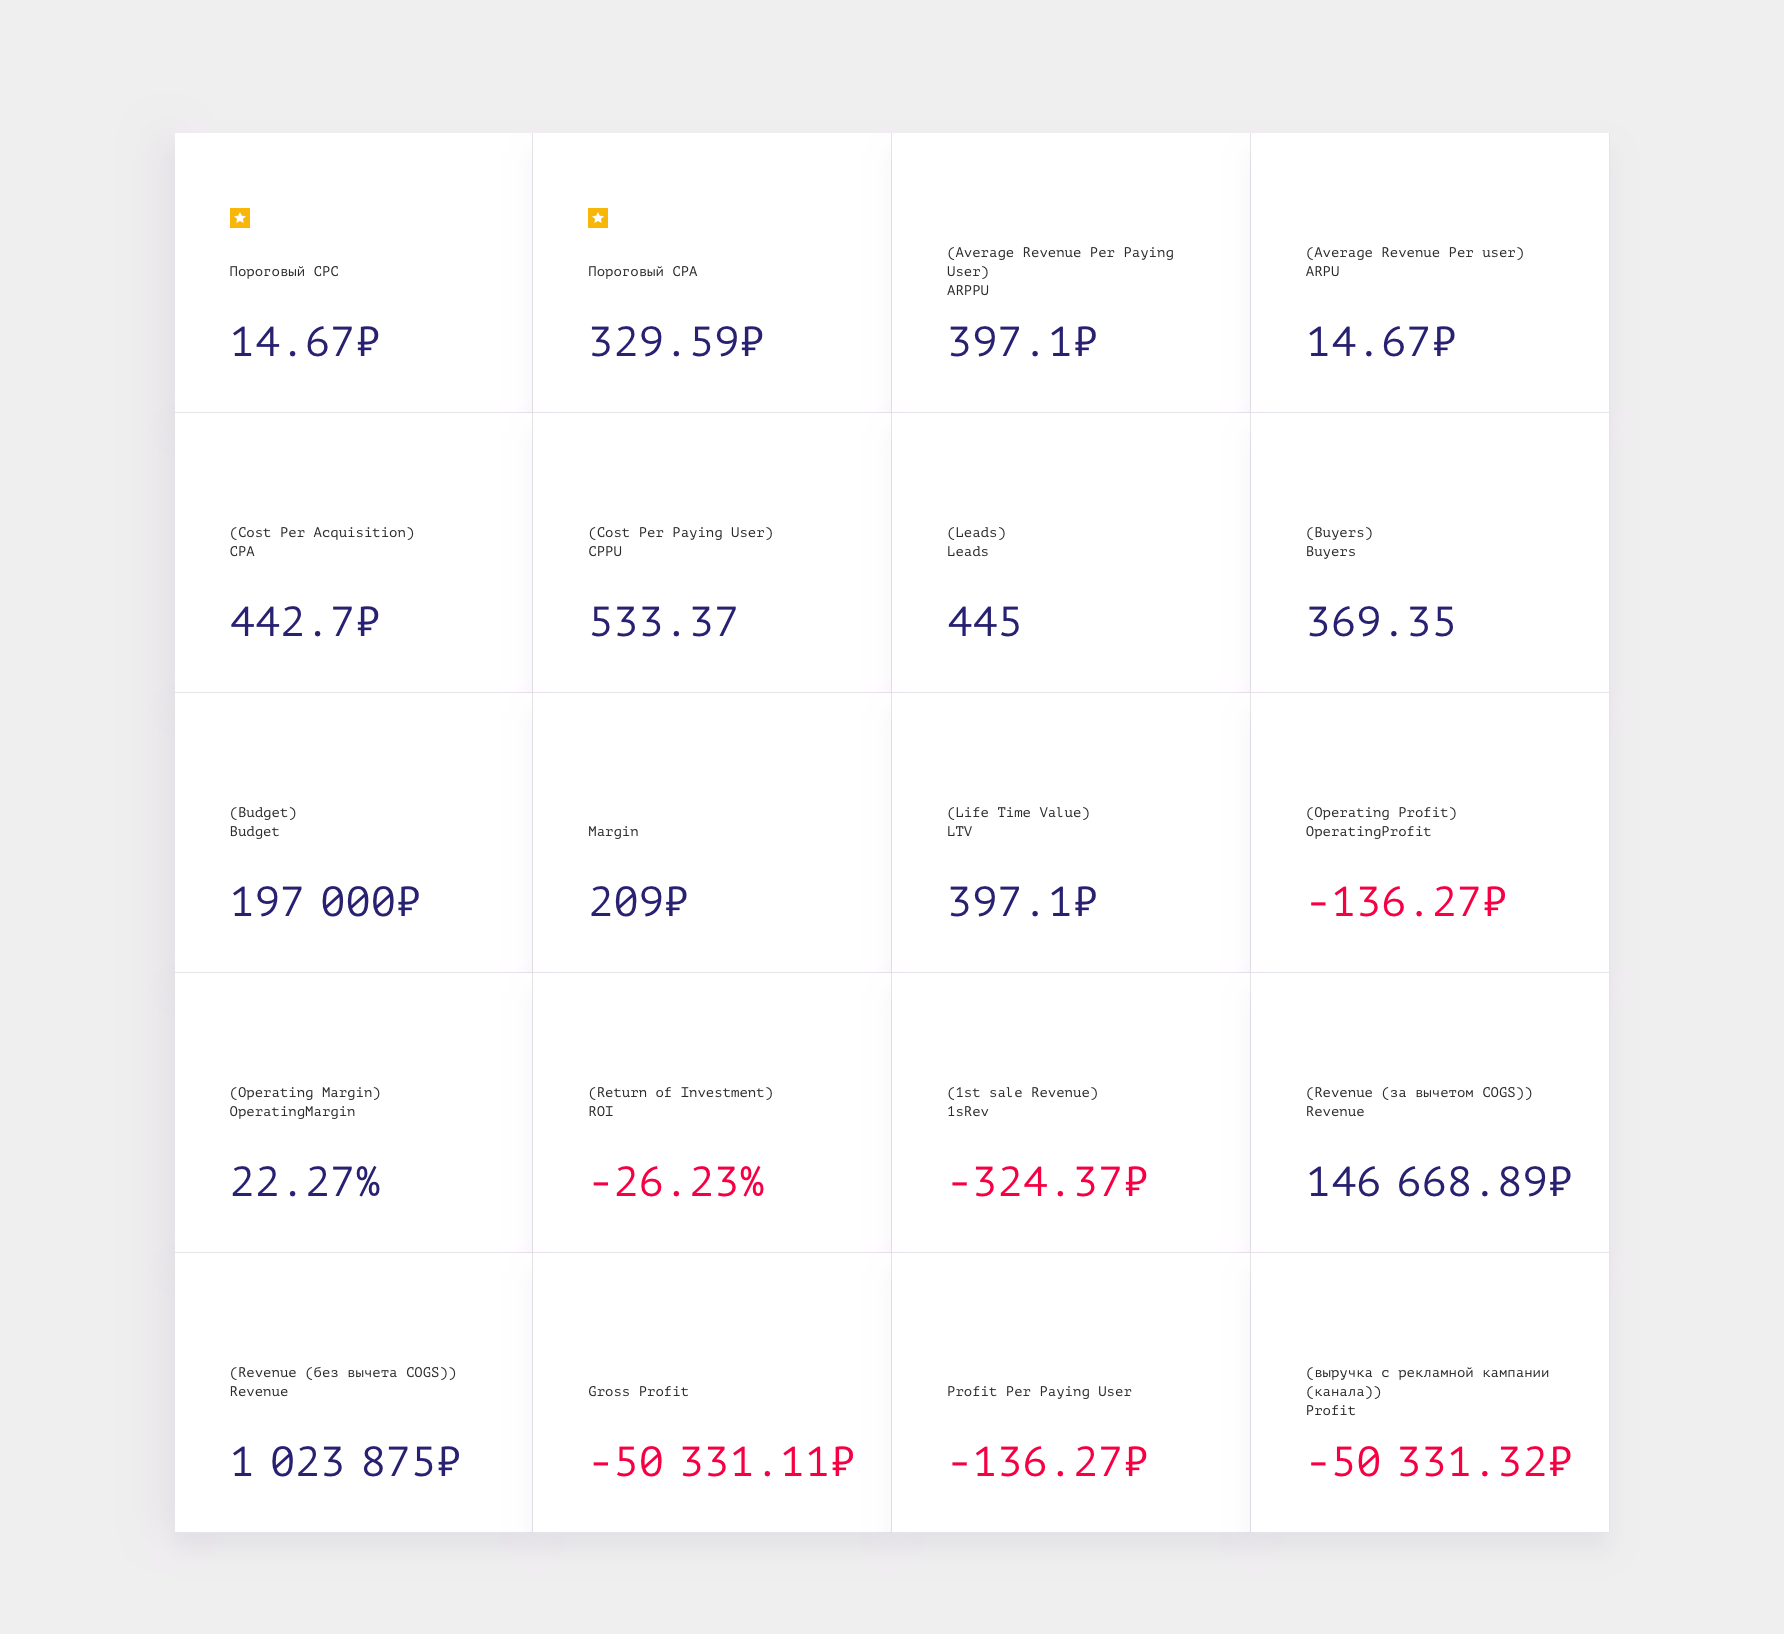
Let’s look at the input data. Direct promises us traffic at 19.7 ₽ (100% of traffic on the query “merries diapers” across Russia), the average price tag on Beru.Ru, Ozon and similar platforms is 1,259–1,359 ₽ per pack. Plus (probably) people will buy some extras. But the margin on the diapers themselves is very low, around 10 per cent. It seems we can get conversion somewhere around 5% and still close a large percentage of orders (if you answer orders and calls and don’t miss them). But at the same time let’s imagine our delivery quality is poor and we don’t work with repeat sales. In the end, because of low retention, we get a negative model.
Case 2. A diaper online store, improved version
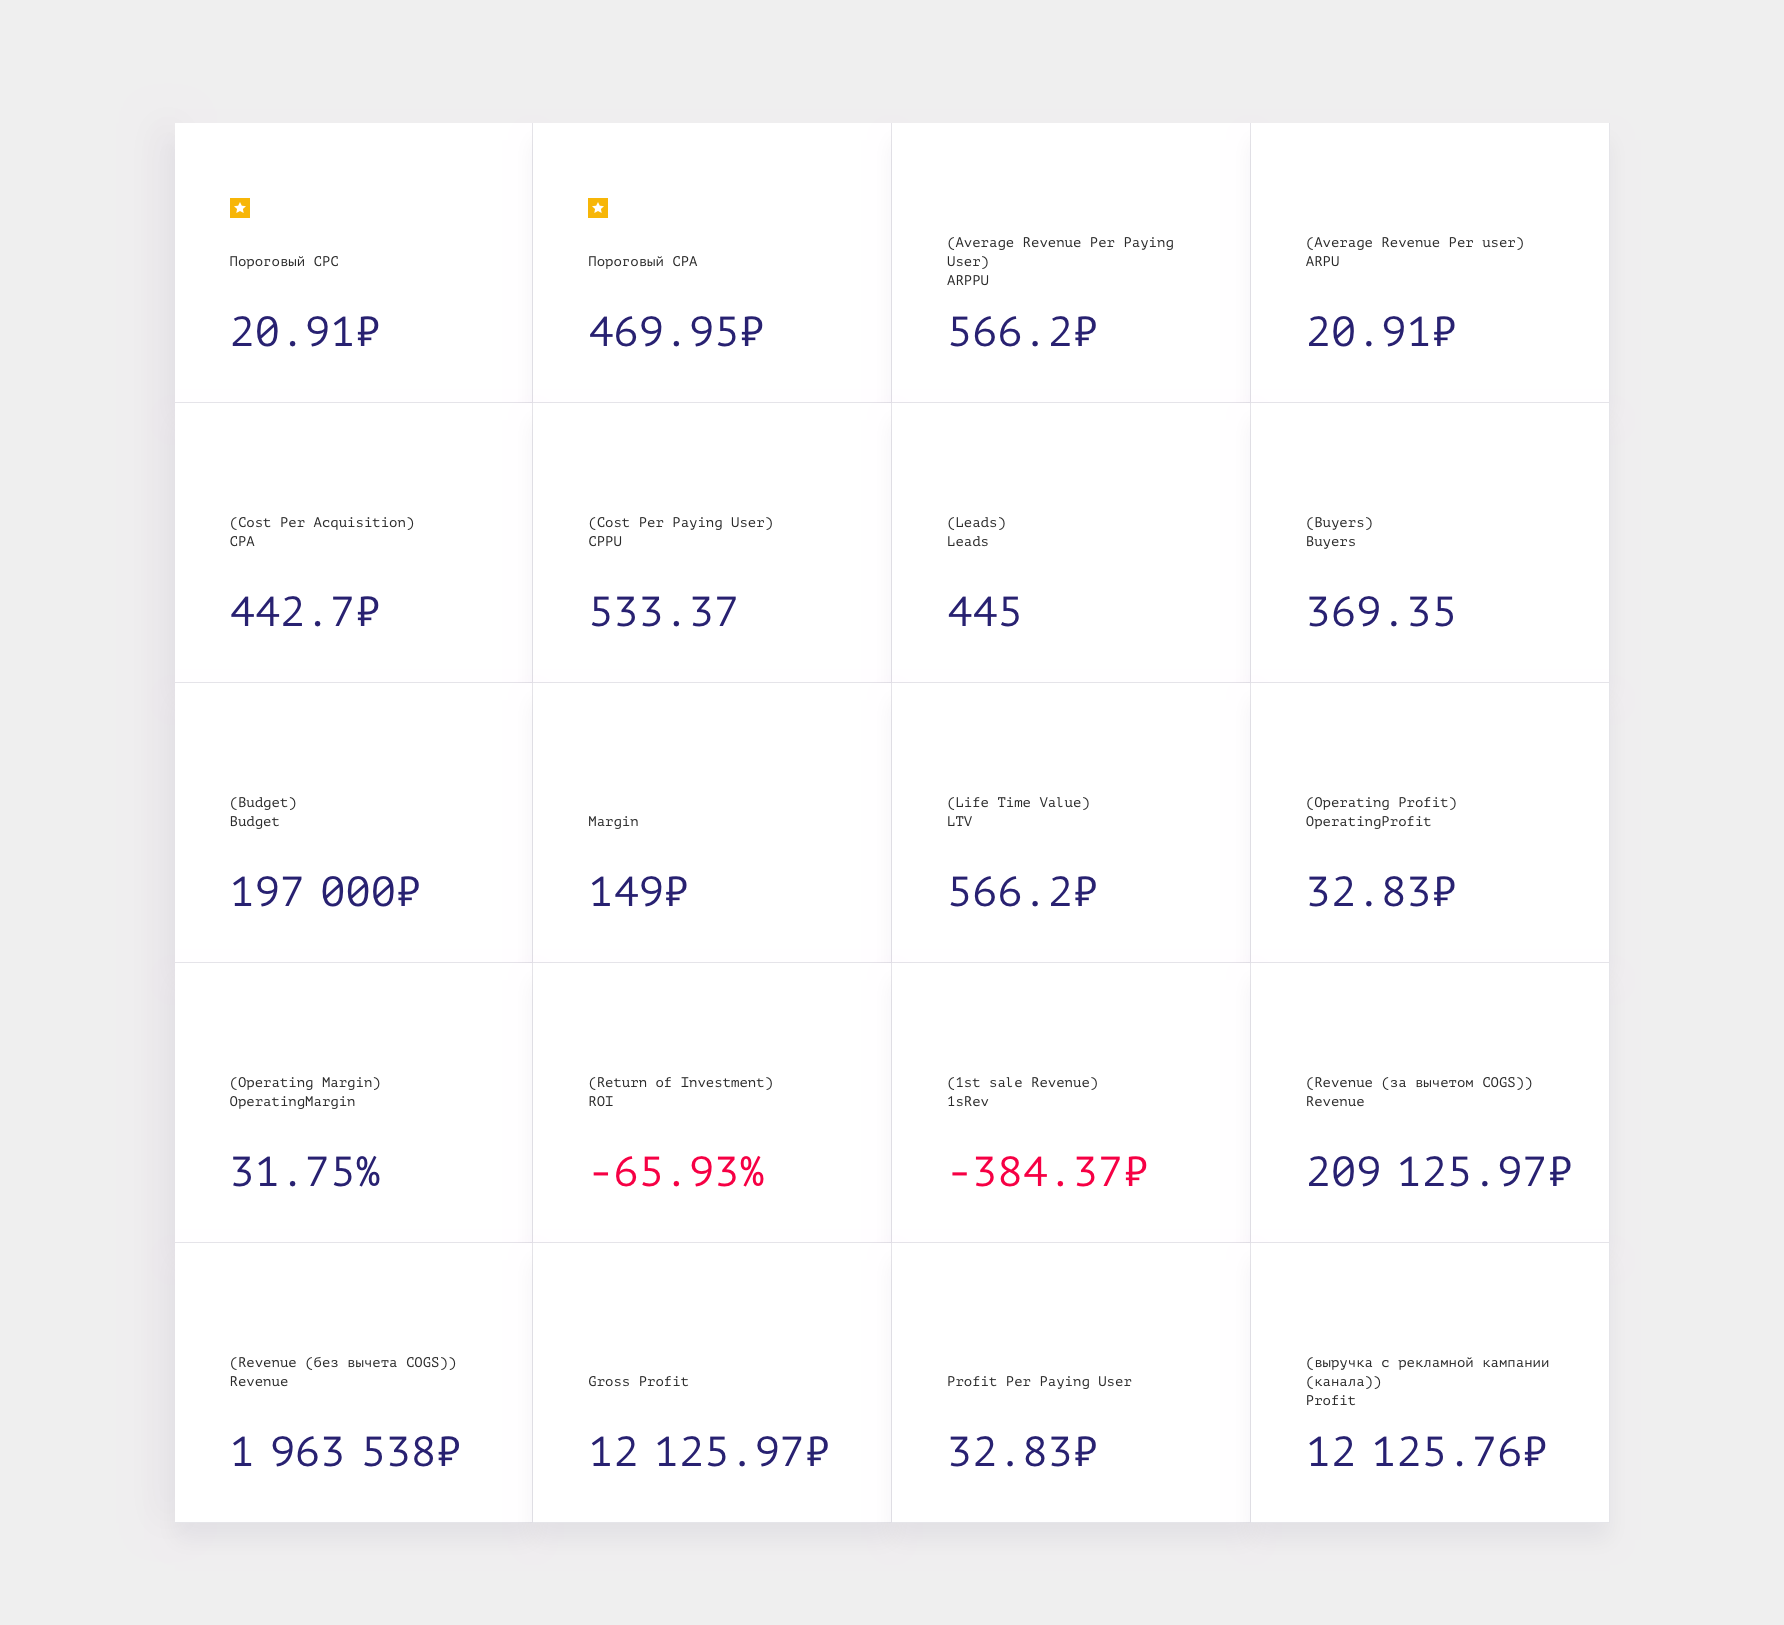
Now let’s imagine we hired a different manager, he brought in a CRM, sorted out the delivery companies and worked out how to bring customers back. Because of discounts and so on the average check dropped a little, but the cost of goods stayed the same. In the end this gain in repeat sales helped the store come out slightly in the black.

Case 3. A diaper online store, improved a bit further
And now let’s imagine the manager started pushing the designers and UXers to come up with something to raise the average check, plus the store added baby food and other goods with a good margin to its range. In the end, by holding on to the retention it had achieved, raising the average check and adding higher-margin goods, the store brought its business model into a pretty decent profit.

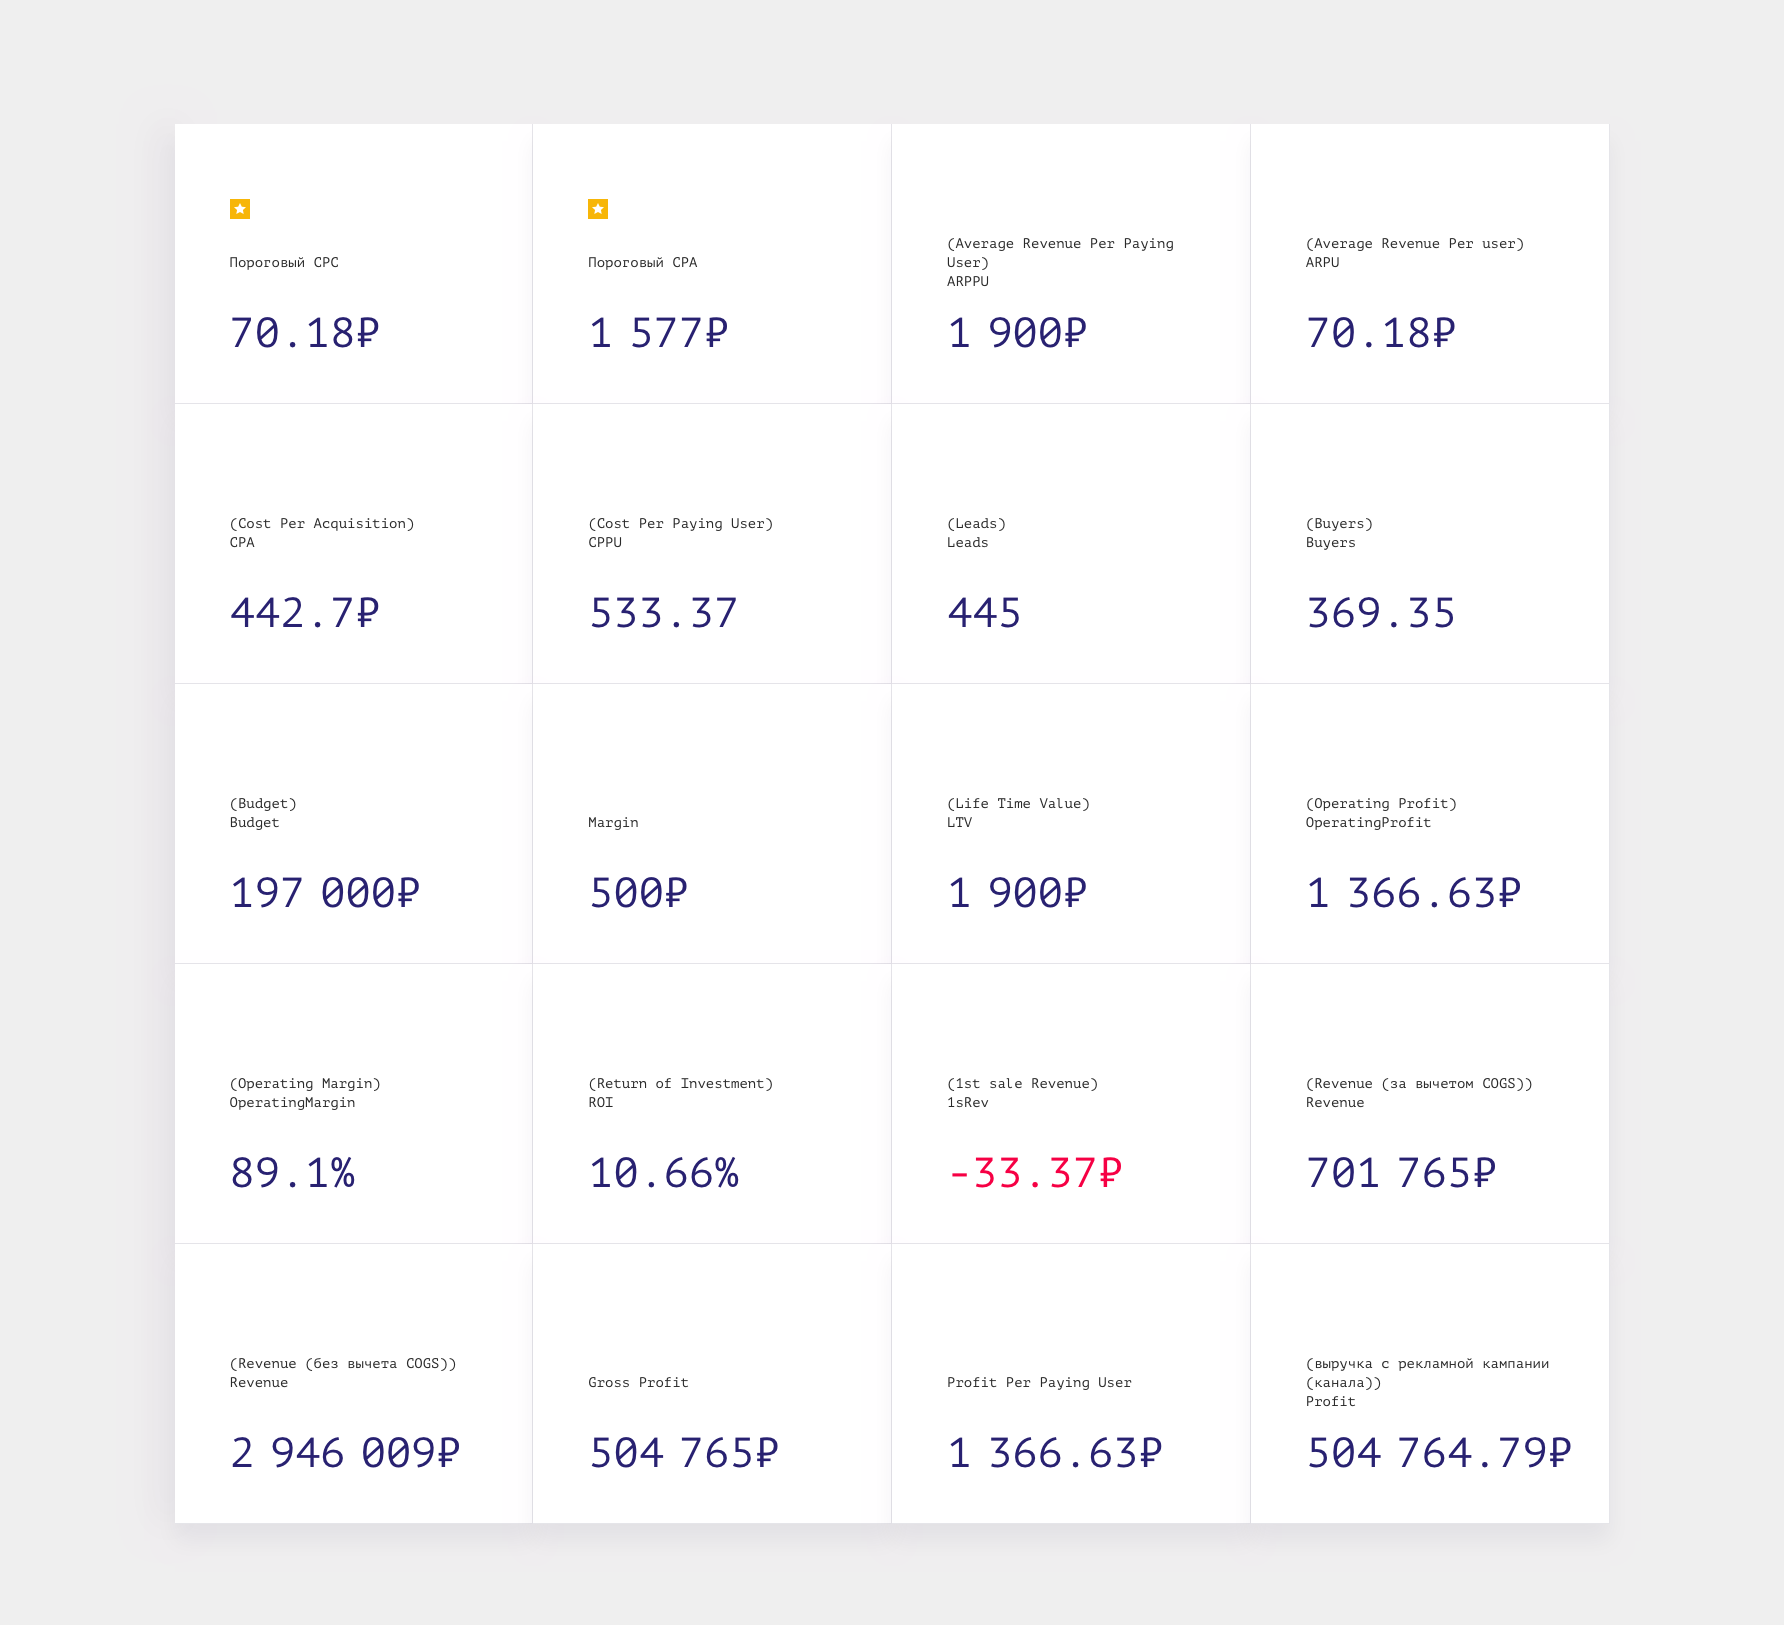
Case 4. Selling machine tools
And now, for contrast, let’s imagine we’re selling machine tools. One machine costs a great deal, and we build a big margin into it. Take a CNC machine, for instance. The first one that comes up in Direct costs almost 3,000,000. Direct promises us 100% of traffic at 28.70 ₽ per click, but at the same time predicts a maximum bid of 300+ ₽, so we’ll budget 49 ₽ per click (we want to be higher up). At the same time conversion isn’t the highest (like many in this niche, our site isn’t optimised for mobile, and we haven’t adjusted our mobile bids, so we get a lot of bounced traffic). And on top of that our sales managers are lazy — they miss enquiries, but since our prices are good we still close around 20 per cent of deals. In the end our leads come out very expensive, and even with retention being nonexistent, we recoup our costs thanks to the high margin.

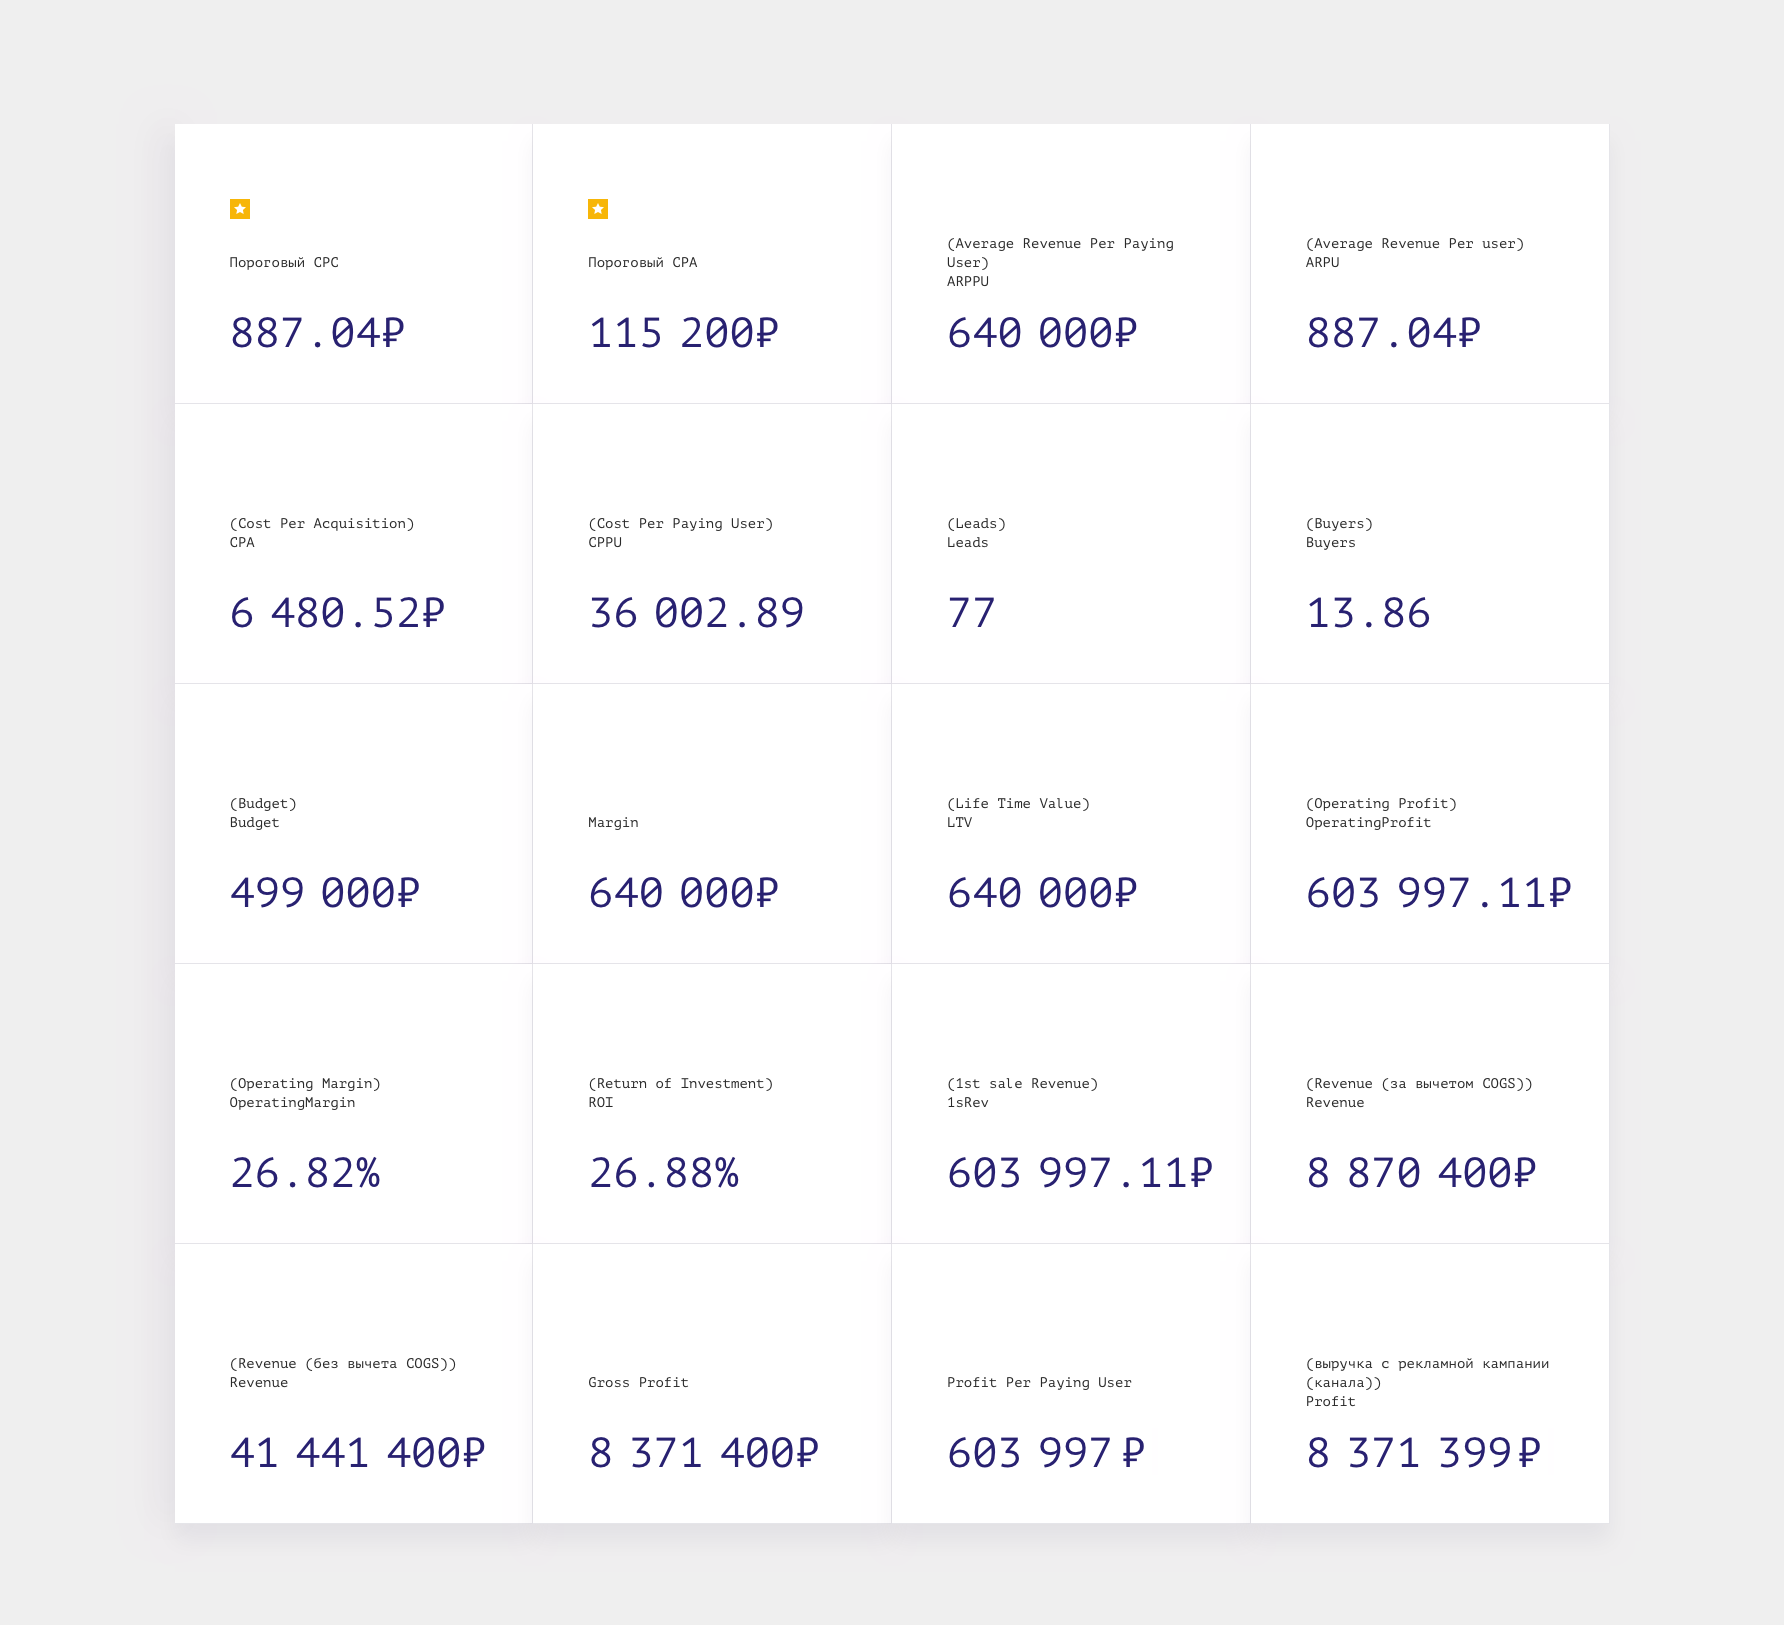
Case 5. Selling machine tools, improved version
And now let’s imagine we redesigned the site, optimised the mobile version and learned to work with mobile traffic among other things. On top of that we gave the sales managers a kick by adding motivation for the percentage of closed deals and for upsells (though it’s important to understand that in this case we haven’t accounted for the site redesign in the costs of this model at all, since those costs have to be spread across all the channels the site is involved in — but even glancing at the resulting gain, we can see it more than covers the most expensive design).
That’s how the calculator lets you quickly test hypotheses :–)

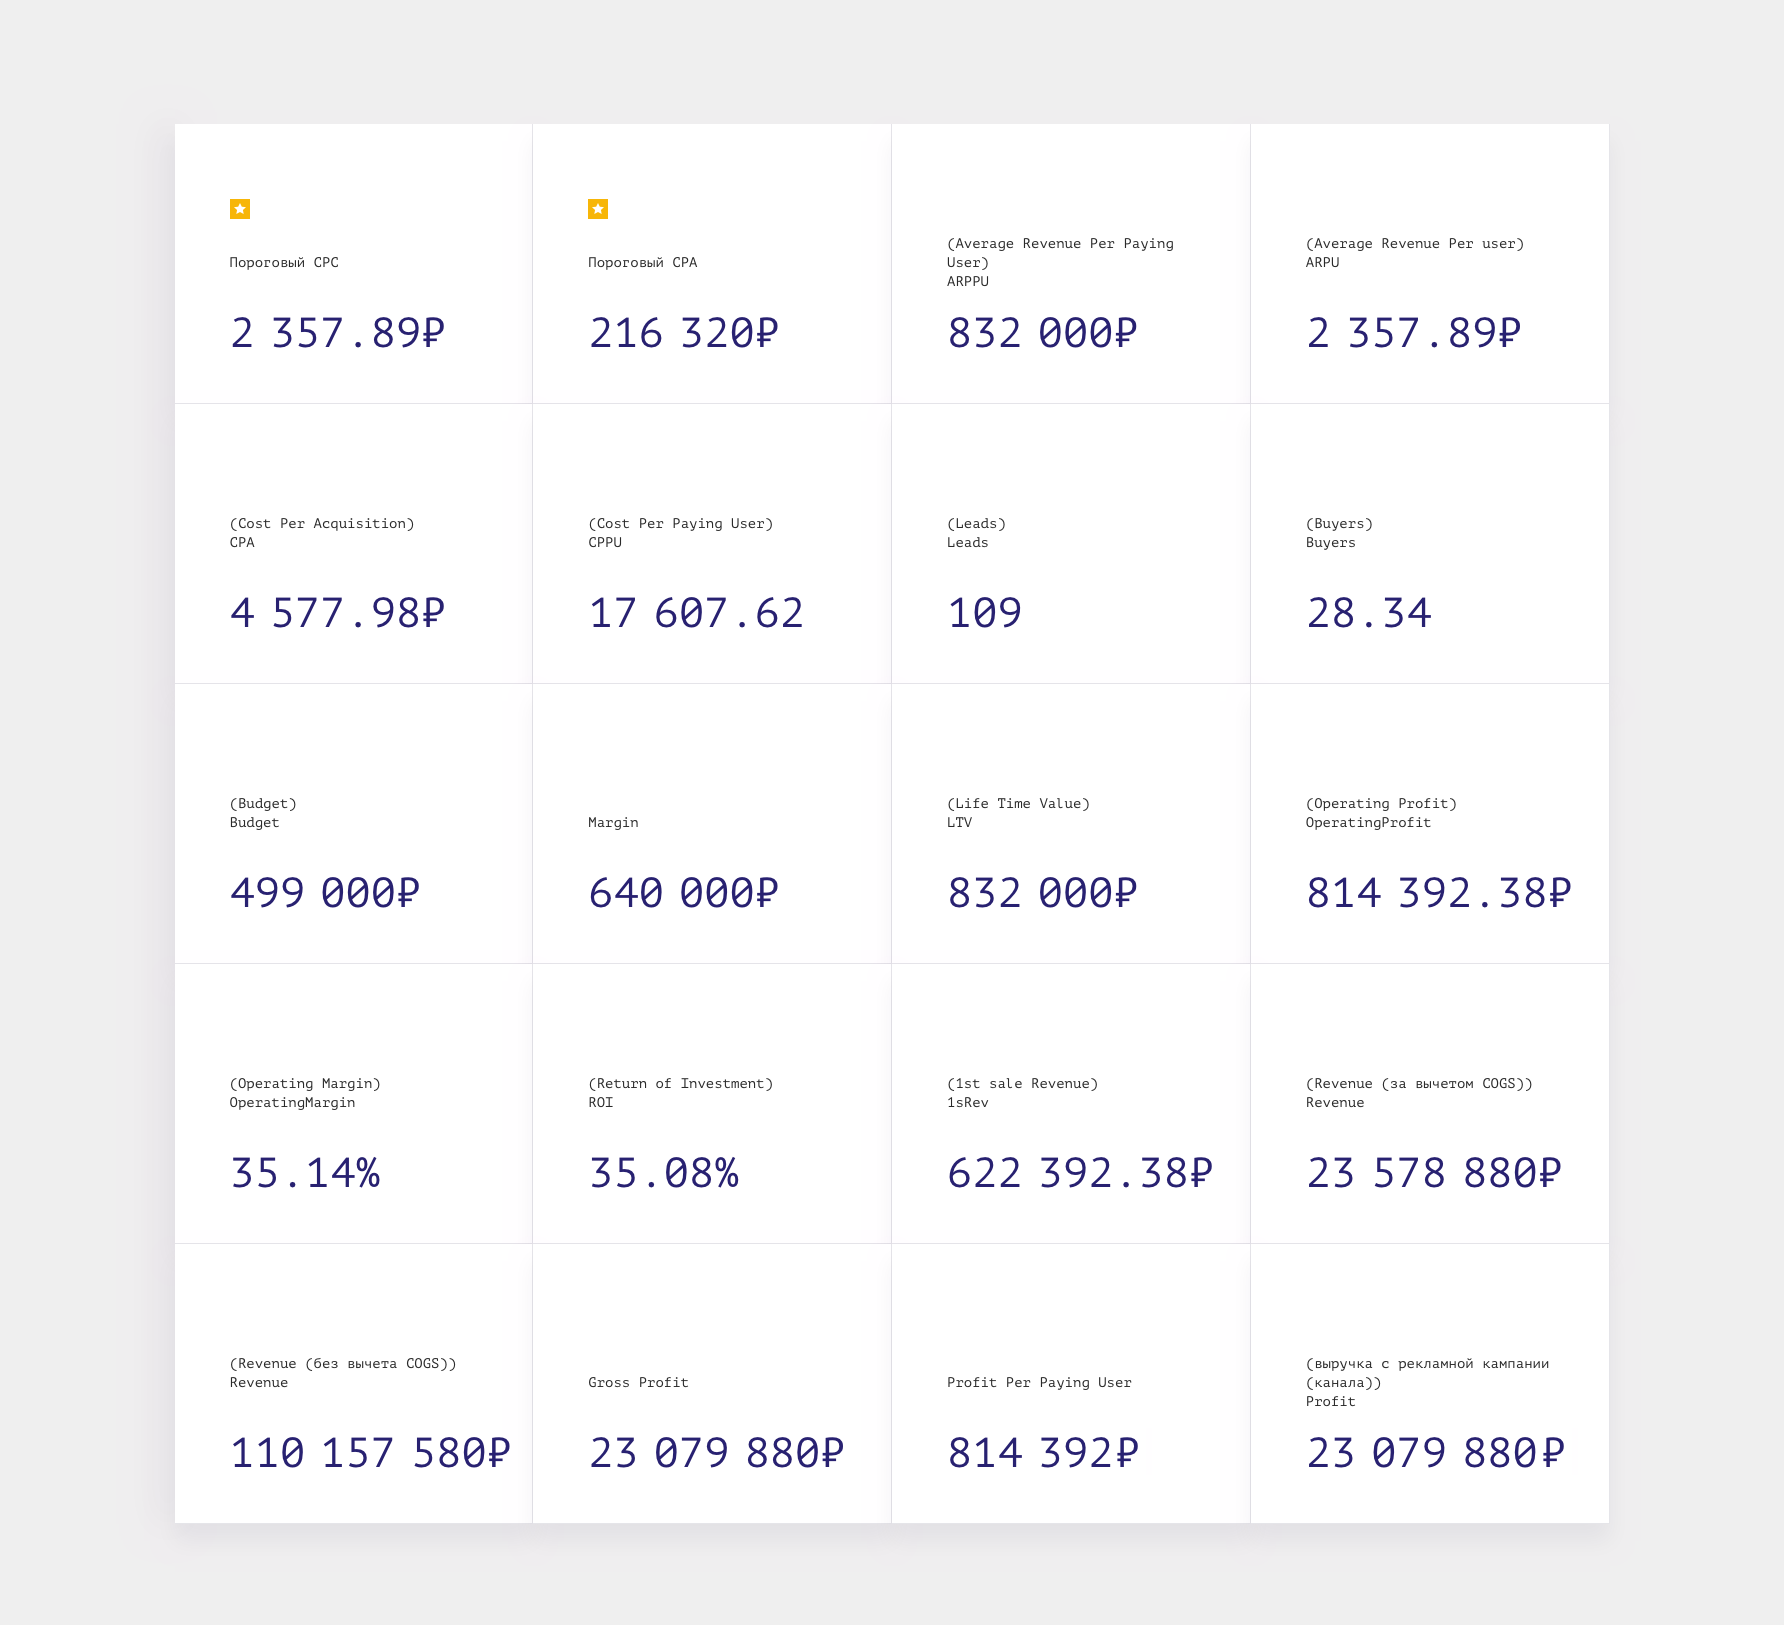
And this is how the calculator lets us hold a conversation about why clients order our services and which instruments will get them to their goals.